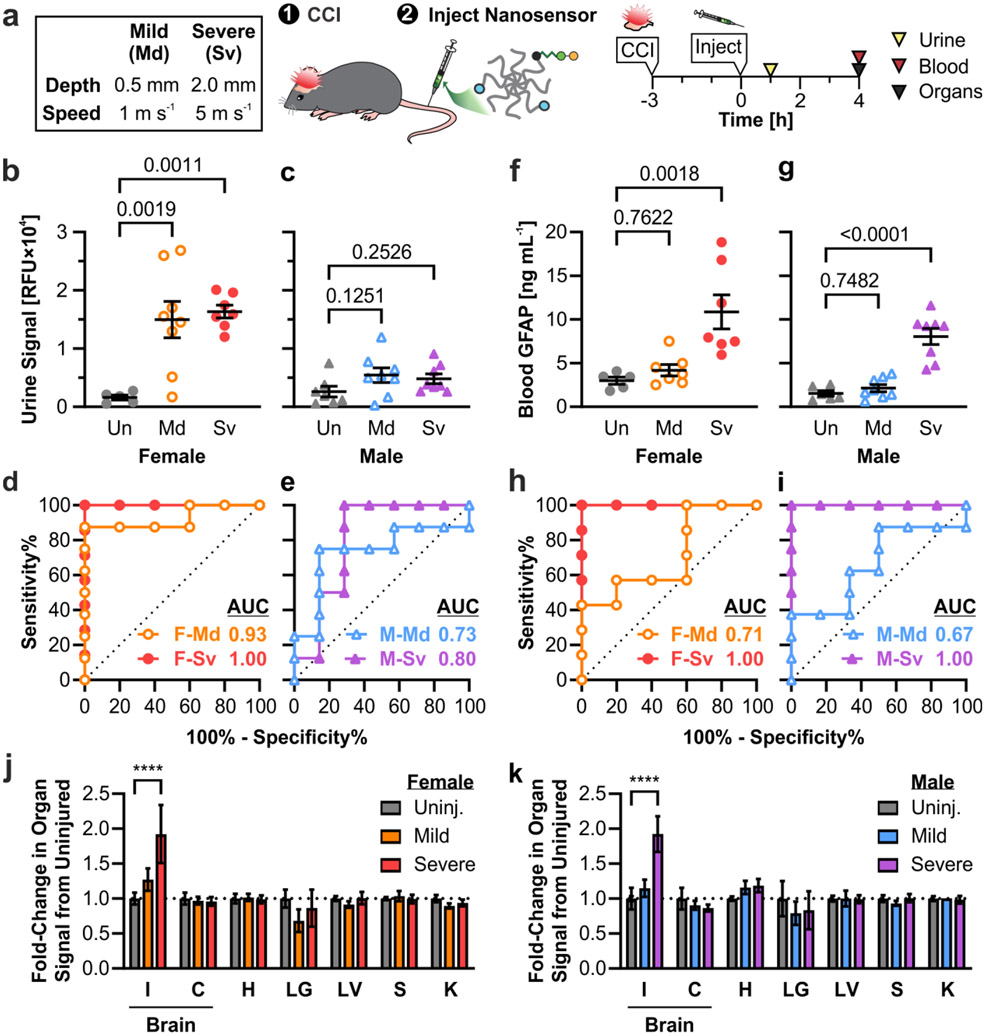
Figure 5. Moderate targeted TBI-ABNs show different patterns of signal with injury in female vs. male mice.
a. Injury conditions in mice and experimental timeline. b, c. TBI-ABN activation in urine at 1 h post-injection as measured by fluorescence and d, e. corresponding ROC curves in female and male mice, respectively (Un = uninjured; Md = mild CCI; Sv = severe CCI; F = female; M = male; n = 5 for F-Un; n = 7 for F-Sv and M-Un; n = 8 for F-Md, M-Md, and M-Sv; mean ± SE, ordinary one-way ANOVA with Dunnett’s multiple comparisons post-hoc test against uninjured control). f, g. GFAP levels in blood at 4 h post-injection as measured by ELISA and h, i. corresponding ROC curves in female and male mice, respectively (n = 5 for F-Un; n = 6 for M-Un; n = 7 for F-Md and F-Sv; n = 8 for M-Md and M-Sv; mean ± SE, ordinary one-way ANOVA with Dunnett’s multiple comparisons post-hoc test against uninjured control). j, k. Relative fold-change of TBI-ABN activation in the brain (I = injured cortical tissue, C = contralateral cortical tissue, with I+C pooled for uninjured control) and in off-target organs (H = heart; LG = lungs; LV = liver; S = spleen; K = kidney) in female and male mice, respectively, with mild or severe CCI compared to uninjured controls (n = 5 for F-Un; n = 7 for F-Sv and M-Un; n = 8 for F-Md, M-Md, and M-Sv; mean ± SE, two-way ANOVA with Dunnett’s multiple comparisons test compared to uninjured within each organ, ****p<0.0001). See Table S2 for additional ROC statistics.

