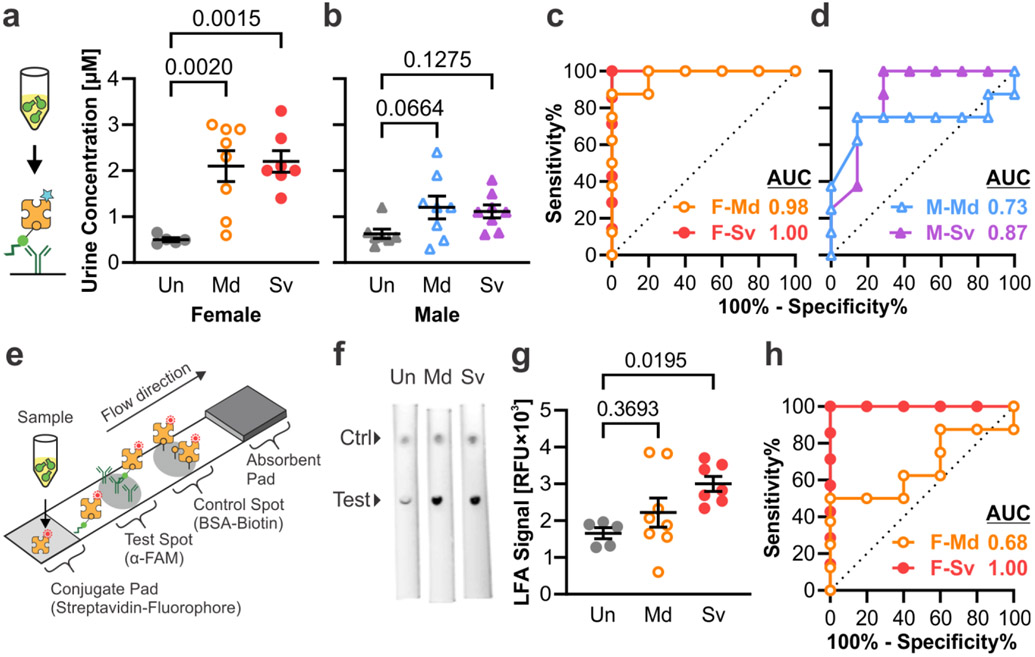
Figure 6. TBI-ABNs can be quantified from urine samples via immunoasssay.
a, b. ELISA measurement of c-Peptide accumulation in urine at 1 h post-injection and c, d. corresponding ROC curves in female and male mice, respectively. (Un = uninjured; Md = mild CCI; Sv = severe CCI; F = female; M = male; n = 5 for F-Un; n = 7 for F-Sv and M-Un; n = 8 for F-Md, M-Md, and M-Sv; mean ± SE, ordinary one-way ANOVA with Dunnett’s multiple comparisons post-hoc test against uninjured control). e. Schematic of LFA developed to measure c-Peptide in samples. f. Representative fluorescence scans of LFAs for urine samples from female mice (ctrl = control). g. Accumulation of c-Peptide in urine at 1 h post-injection as measured by integrated test spot signal from each LFA and h. corresponding ROC curves in female mice (n = 5 for F-Un; n = 7 for F-Sv; n = 8 for F-Md; mean ± SE, ordinary one-way ANOVA with Dunnett’s multiple comparisons post-hoc test against uninjured control). See Table S2 for additional ROC statistics.

