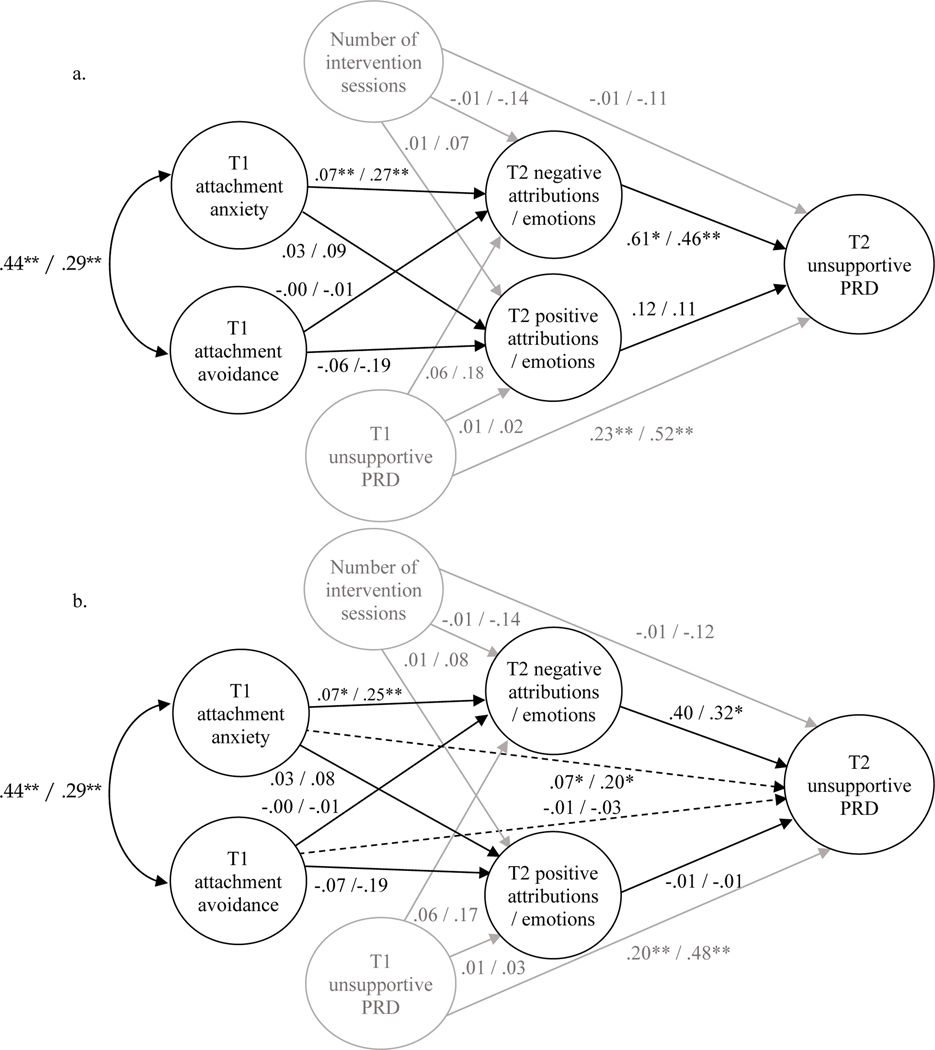
Figure 3. Structural Model 1 (a) and Structural Model 2 (b) with Unstandardized / Standardized Path Coefficients.
Note. Dotted lines represent direct paths between mothers’ attachment style and parenting behavior. Disturbances of the positive and negative attributions/emotions factors statistically significantly covaried (−.07** / −.59** for Model 1 and −.07** / −.56** for Model 2; not shown for clarity). Covariates are depicted in grey. Structural Model 1 (a) was retained. T1 = Time 1; T2 = Time 2; PRD = Parental response to child distress. *p < .05. **p < .01.

