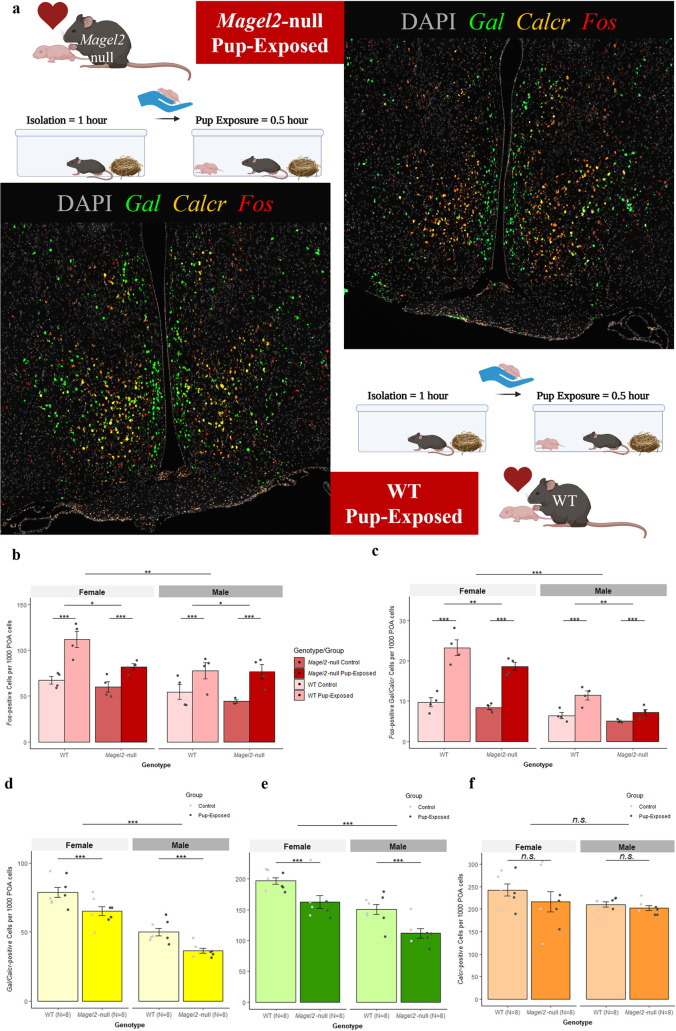
Fig 7. c-Fos Expression in the POA of Pup-Exposed and WT mice.
(A) Representative POA Gal/Calcr c-Fos Images from Pup-Exposed mice. Magel2-null mice (Top) and WT mice (Bottom) were either paired to produce litters and then used as the Pup-Exposed group (N = 4 per genotype) or were left undisturbed to act as Controls (N = 4 per genotype). Pup exposure consisted of reintroducing pups to the mice following a 1-hour isolation period and exposing the mice to pups for 30 minutes prior to tissue harvest. Control mice were isolated for 1 hour but were not exposed to pups and underwent tissue harvest immediately afterwards away. Images present DAPI (Grey) stained nuclei alongside RNA molecules of Gal (Green), Calcr (Orange) and c-Fos (Red). (B) Number of c-Fos positive (≥5 molecules) cells per 1000 POA cells of Magel2-null mice and WT mice either exposed to pups or controls. (C) Number of c-Fos positive (5+ molecules) cells also expressing Gal and Calcr (2+ molecules) per 1000 POA cells of Magel2-null mice and WT mice either exposed to pups or controls. (D) Number of Gal/Calcr positive (2+ molecules each) cells per 1000 POA cells of Magel2-null mice and WT (regardless of exposure). (E) Number of Gal positive (2+ molecules) cells per 1000 POA cells of Magel2-null mice and WT mice (regardless of exposure). (F) Number of Calcr positive (2+ molecules) cells per 1000 POA cells of Magel2-null mice and WT mice (regardless of exposure). Created with Biorender.

