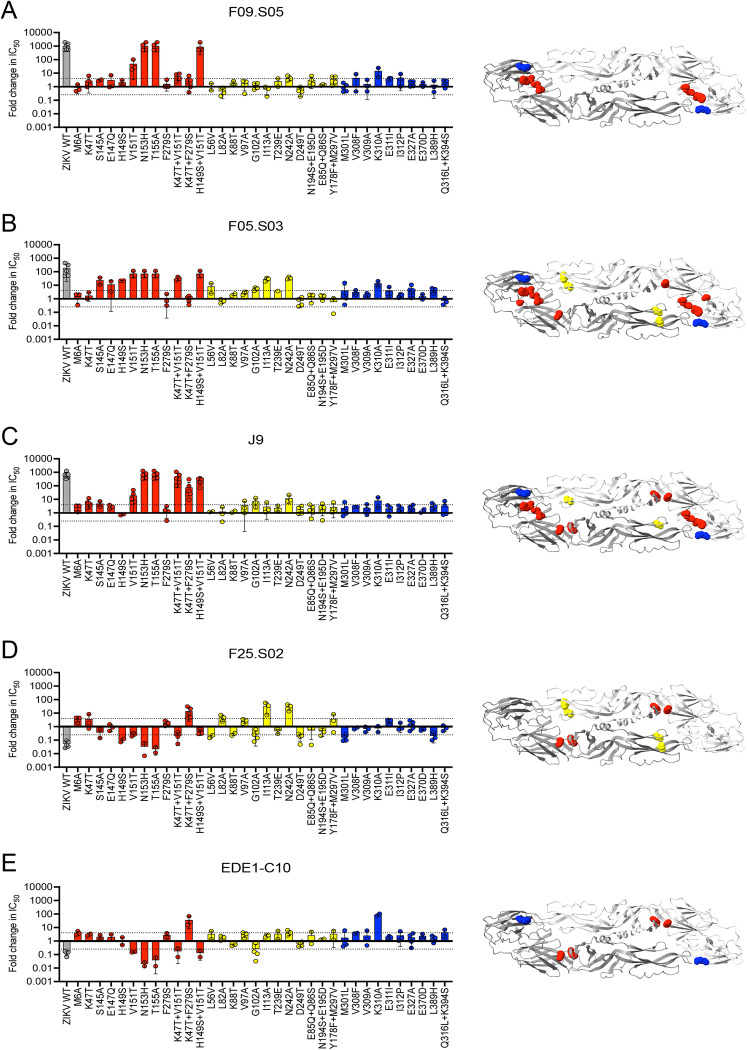
Fig 5. E protein residues critical for neutralization by bnAbs.
(Left panel) Bar graphs show the mean IC50 fold change against DENV2 16681 reporter virus particles encoding E protein variants relative to wild type (WT) DENV2 for antibodies (A) F09.S05, (B) F05.S03, (C) J9, (D) F25.S02, and (E) EDE1-C10. Sites in E domains I, II, and III are shown in red, yellow, and blue, respectively. Values of 1, >1, and <1 indicate no change, decreased sensitivity, and increased sensitivity of mutant relative to WT DENV2, respectively. Mean values were obtained from at least 2 independent experiments shown as individual data points in which WT and mutant DENV2 were tested in parallel. WT ZIKV H/PF/2013 (gray) was included as a control. Error bars indicate the standard deviation (n>2) or range (n = 2). In each graph, the dotted horizontal line represents a 4-fold IC50 change. (Right panel) For each bnAb, sites of mutations that reduced neutralization potency when tested either individually or in combination by > 4-fold are depicted as spheres on both monomers of the DENV2 E dimer subunit (PDB 1OAN).

