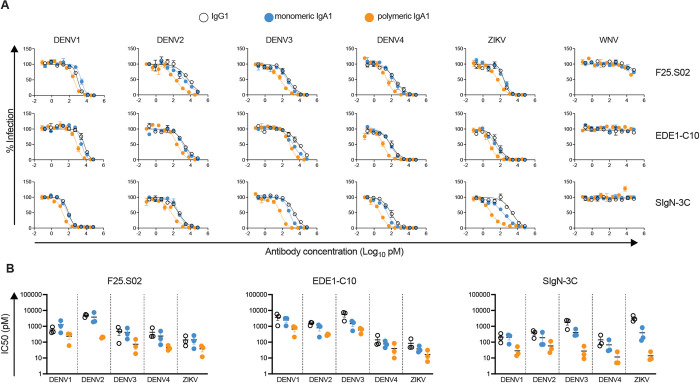
Fig 6. Neutralization profile of antibodies expressed as IgA1.
(A) IgG1 (open circles), monomeric IgA1 (blue circles), and polymeric IgA1 (orange circles) versions of F25.S02 (top row), EDE1-C10 (middle row), and SigN-3C (bottom row) were tested for their ability to neutralize DENV1 WP-74, DENV2 16681, DENV3 CH53489, DENV4 TVP376, and ZIKV H/PF/2013 reporter virus particles. Dose-response curves are representative of 3 independent experiments, each tested in duplicate wells. Data points and error bars represent the mean and range of the duplicates, respectively. (B) Comparison of IC50 values of F25.S02 (left), EDE1-C10 (middle), SigN-3C (right) expressed as IgG1, monomeric IgA1, and polymeric IgA1 against the viruses indicated on the x-axes. Color scheme is similar to (A). Each data point represents an independent experiment in which antibody isotypes were tested in parallel. Horizontal bars indicate the mean. Error bars represent the standard error of the mean.

