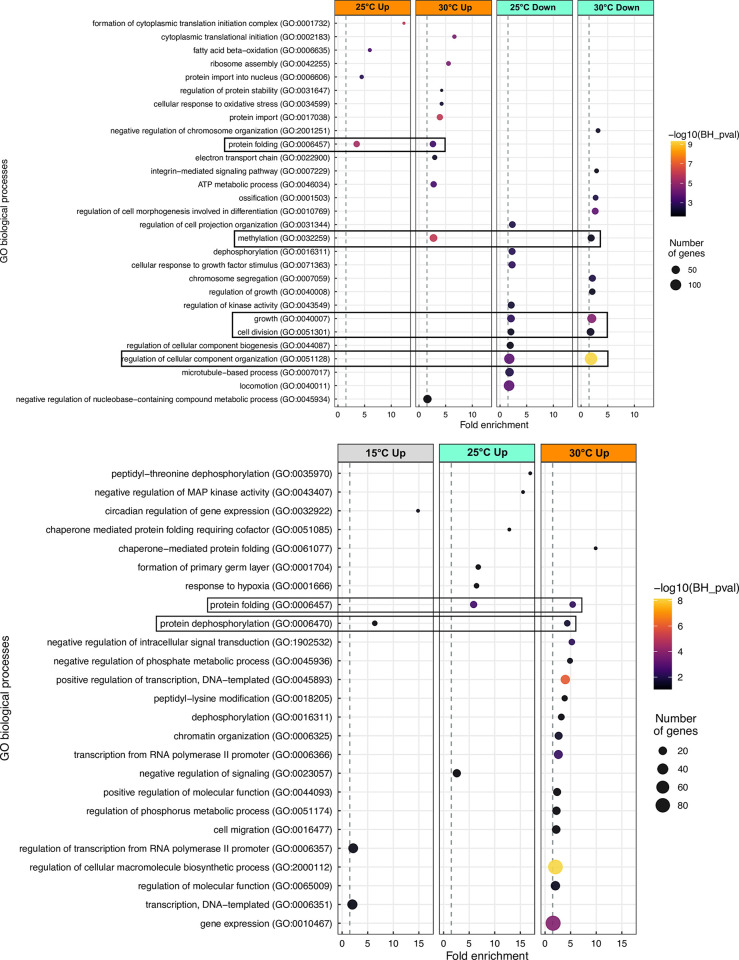
Fig 6. Bubble plots of the top 10 representative enriched GO terms (biological processes) in juvenile Striped Bass acclimated to various temperatures, and from one of two treatments (A = Acclimation; B = CTmax).
For acclimation, differential expression was defined as difference from 15°C acclimated fish; For CTmax, differential expression was defined as difference from respective temperature acclimation control. Top representative GO terms were selected based on clustering analysis (REVIGO). GO terms are ordered top to bottom by decreasing fold-enrichment. Boxes highlight GO terms which are shared across at least two acclimation temperatures. The dotted line represents the lower fold-enrichment cut-off of 1.5. Only upregulated GO terms are displayed for CTmax data (B) the respective DEG lists were too small to allow for GO analysis.

