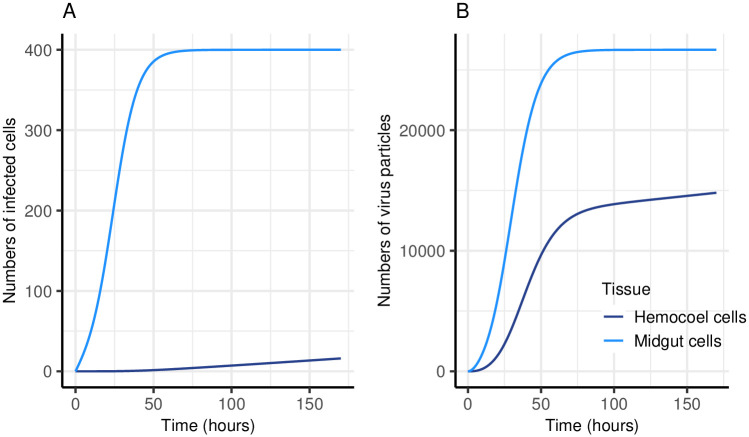
Fig 2. Simulation of virus infection and replication within a single mosquito.
A: Numbers of infected cells over time. B: Numbers of virus particles over time. The model tracks numbers of virions in the blood meal (Gv), numbers of infected midgut cells (Mc) (total cells 400 (cmax)), numbers of virions produced in the midgut (Mv), numbers of infected hemocoel cells (Hc) (total cells available 900 (hmax)) and numbers of virions in the hemocoel (Hv). The model is run in hourly time steps and a single simulation was run for the equivalent of seven days, with an initial input of 3000 virus particles (Gv). The rate at which susceptible cells become infected (β) was set to 10−8 h−1, the virus decay rate (μV) was 0.1 h−1, the rate virions spread between cells (α) was 10−3.5 h−1, the rate at which virions are produced by infected cells (γ) was 10 h−1 and the rate virions escape from the midgut into the hemocoel (ρ) was 0.05 h−1.

