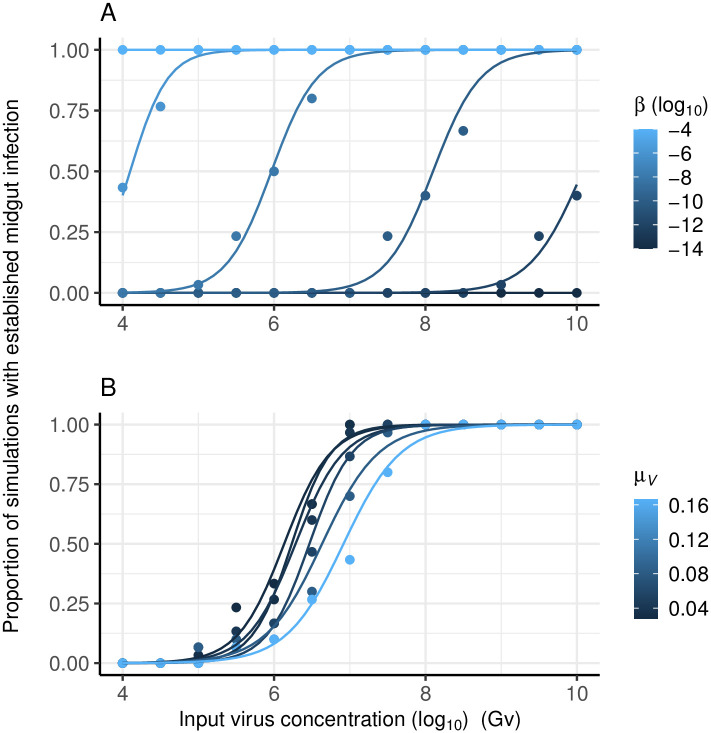
Fig 3. The dose-response of the probability of mosquito midgut infection.
Model outputs (points) and fitted logistic regression (lines). Showing the effect of varying: A) the rate at which virions infect susceptible cells (β); and B) the virus decay rate (μV). Each point reflects the results of 30 model simulations. For A, μv was set to 0.02 h−1, the virus production rate (γ) was 20 h−1, the rate of cell spread (α) was 10−4 h−1 and the escape rate (ρ) 0.12 h−1.

