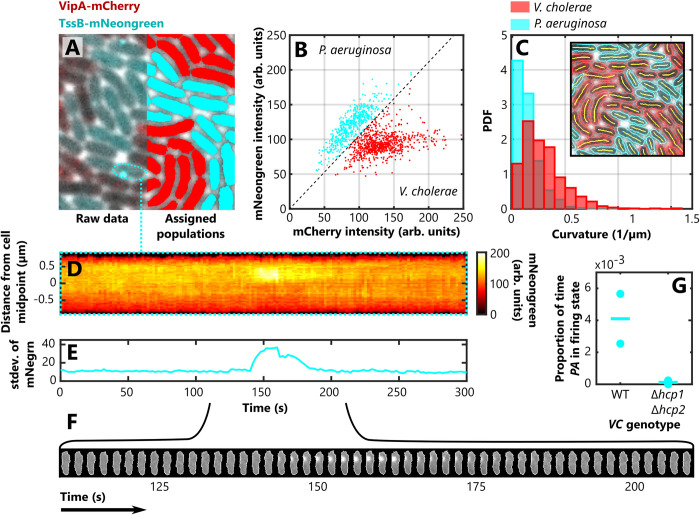
Fig 6. Identifying different bacterial species, quantifying cell morphologies, and investigating T6SS dynamics in a densely packed collective.
(A) A monolayer composed of a mixture of P. aeruginosa cells expressing TssB-mNeongreen and V. cholerae cells expressing VipA-mCherry (left). Measurements of the average intensity of each cell in the two different fluorescence channels allowed us to automatically distinguish the two species (B), an approach known as image cytometry. By colour coding each cell (P. aeruginosa, cyan, V. cholerae, red), we were able to visually confirm the accuracy of the assignment process (A, right). (C) We then quantified a novel feature, cell curvature, using FAST’s custom feature extraction framework to calculate the curvature of the segmentation backbones (inset). Splitting these measurements into the two previously assigned populations showed the comma shaped V. cholerae cells were substantially more curved than the rod-shaped P. aeruginosa cells. (D-F) We then used FAST’s plotting options to illustrate the dynamics of the T6SS. A P. aeruginosa cell fires its T6SS machinery (observed as the bright puncta of TssB), which can be visualised using the kymograph (D) and ‘cartouche’ (F) plotting options, and which also leads to an increase in the standard deviation of the mNeongreen channel (E). (G) We used this latter measurement to detect when the T6SS was active in a cell, allowing us to measure the proportion of time that each cell in the population spends in the firing state. Our analyses confirmed that when co-cultured with a strain of V. cholerae with an inactive T6SS (Δhcp1 Δhcp2), the T6SS activity of WT P. aeruginosa cells is dramatically reduced compared to when they are co-cultured with WT V. cholerae. Here the circles show averages from separate movies and horizontal lines show the mean for all samples of a given combination of genotypes.

