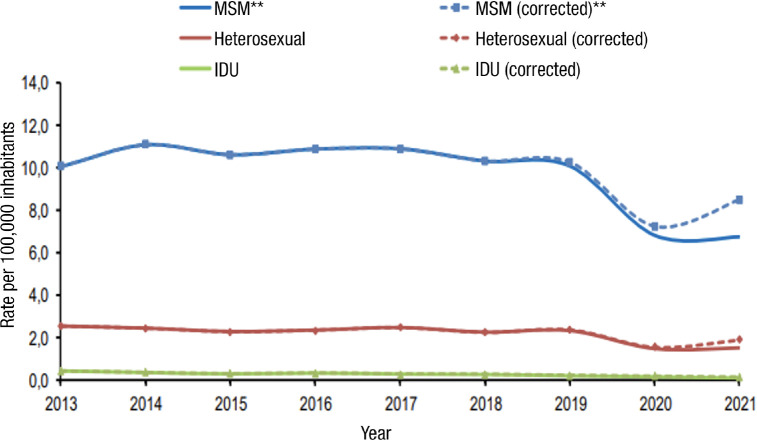
Figure 1.
Rates (per 100,000 population) of total annual new HIV diagnoses and by mechanism of transmission (2013-2021). Data corrected for delay in notification. Source: HIV, STI and hepatitis surveillance unit. Adapted from reference [3].
** Rate per 100.000 men, MSM: Men who have sex with men; IDU: injecting drug use

