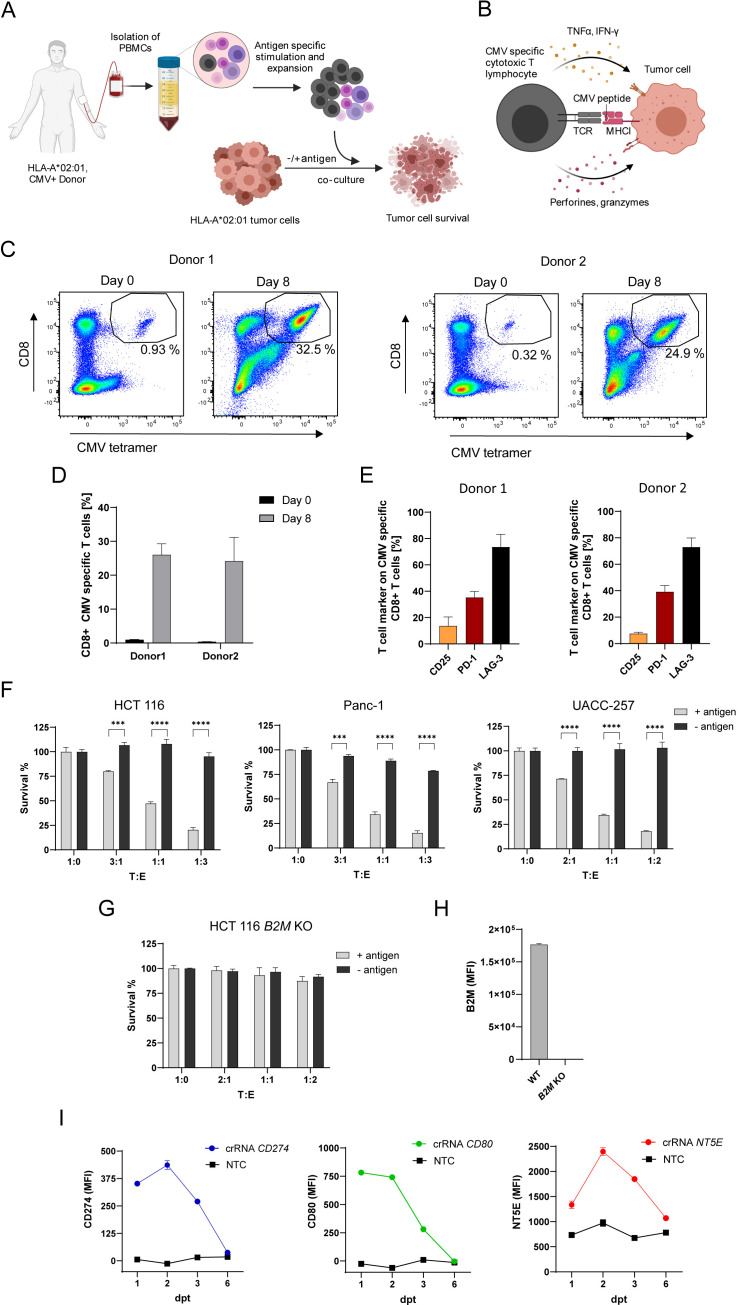
Figure 1. In vitro system to investigate genes function in antigen-specific tumor killing.
(A) Schematic of CMV specific CTL expansion within isolated PBMCs from HLA-A*0201 healthy CMV-seropositive Donors followed by tumor killing assay. Tumor cells either loaded with CMV pp65 antigenic peptide or untreated were co-cultured with PBMCs containing antigen specific CTLs and tumor cell survival was measured using a luminescent cell viability assay. (B) Schematic of CMV-specific tumor killing by CTLs. CMV-specific CTL recognize CMV antigen presented in an HLA-A*02:01 restricted manner on tumor cells and release cytokines and cytotoxic granules containing perforins and granzymes to specifically kill tumor cells. (C) Representative dot plots of CMV pp65495-503 tetramer-positive/CD8 + T cells measured at day 0 and day 8 after stimulation for both Donors used in this study (each n=3). (D) Bar graph of acquired frequency of CMV pp65495-503 tetramer-positive/CD8 +T cells (n=3). (E) Amount of CD25+, PD-1 +and LAG-3 +CMV specific CD8 + T cells (n=3). (F) Cell survival of HCT 116, Panc-1 and UACC-257 after 3 days of co-culturing with different ratios of PBMC containing antigen specific CTLs in antigen presence or absence. Bar graphs show normalized mean ± SD of triplicate representative for three independent experiments. Statistical significance was calculated using two-tailed t tests with adjustments for multiple comparisons (***p<0.001****, p<0.0001). (G) Cell survival of HCT 116 B2M KO cells assessed with tumor killing assay. Bar graphs show normalized mean ± SD of triplicate representative for two independent experiments. (H) Median fluorescence intensity of B2M expression of HCT 116 and B2M KO cells measured with flow cytometry (n=2). (I) Mean fluorescence intensities over time of PD-L1, CD80 and NT5E in HCT 116 dCas9 cells after induction of gene expression using CRISPRa compared to non-targeting control (NTC) (n=2).

