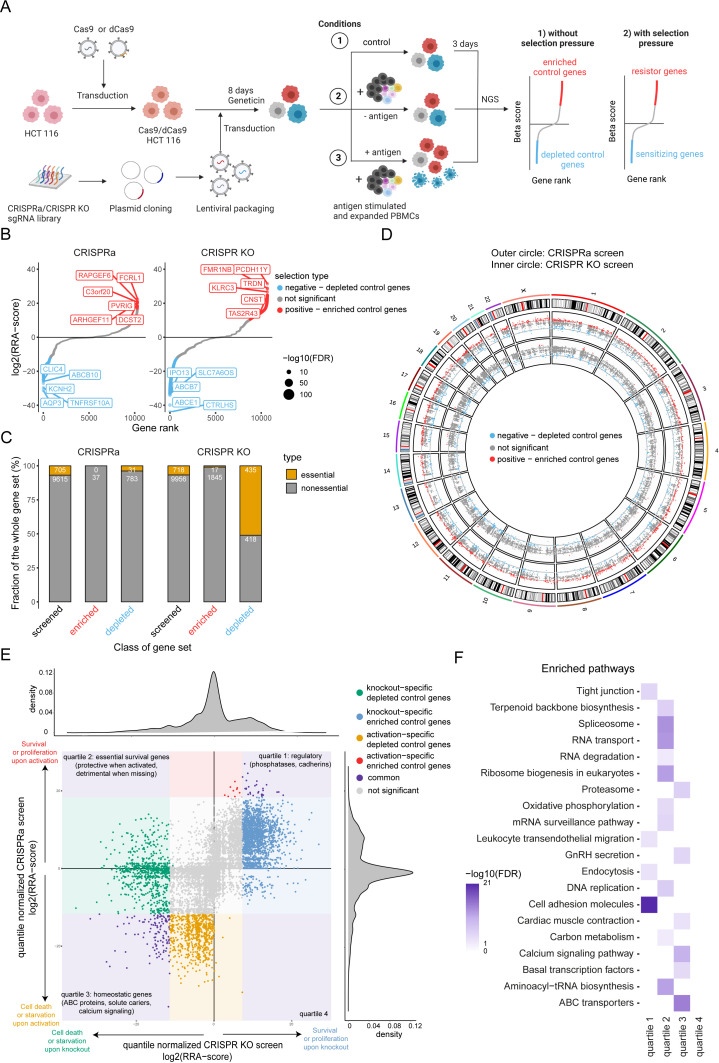
Figure 2. Design of a complementary CRISPR activation/CRISPR KO screen.
(A) Schematic of complementary CRISPR KO/CRISPRa screen setup. HLA-A*0201+ HCT 116 Cas9 or dCas9 colon carcinoma cells were transduced with the respective sgRNA library targeting approx. 10,000 annotated genes. Cells were exposed to PBMCs containing antigen specific CTLs in the presence or absence of CMV antigenic peptide. Control condition was not exposed to PBMCs and antigen. Next-generation sequencing (NGS) was used to determine sgRNA representation of each condition. Each condition was performed in triplicate. (B) Ranked-ordered, RRA scores (robust ranking aggregation; log2 fold change) for control selection CRISPRa (left) and CRISPR KO (right) screens in absence of PBMCs and antigen. Hits at FDR <2% are highlighted in red (positive selection – enriched control genes) and blue (negative selection – depleted control genes) with the top ten best scoring hits being indicated. (C) Enrichment of essential genes (orange; Atlas project - Depmap) as a fraction of gene subset: all screened (black), enriched control genes (red), and depleted control genes (blue) for CRISPRa (left) and CRISPR KO (right) screens. The raw gene counts are indicated in white. (D) Overview of gene coverage per chromosome for CRISPR KO (inner circle) and CRISPRa (outer circle); red - enriched control genes, blue - depleted control genes, gray - not significant gene hits. (E) Global relation of screened genes between CRISPRa and CRISPR KO assays: purple – common gene hits, red and blue – enriched control gene hits (CRISPRa and CRISPR KO respectively), orange and green - depleted control gene hits (CRISPRa and CRISPR KO respectively). (F) Most significant pathways according to KEGG enriched among the significant gene hits of (E).

