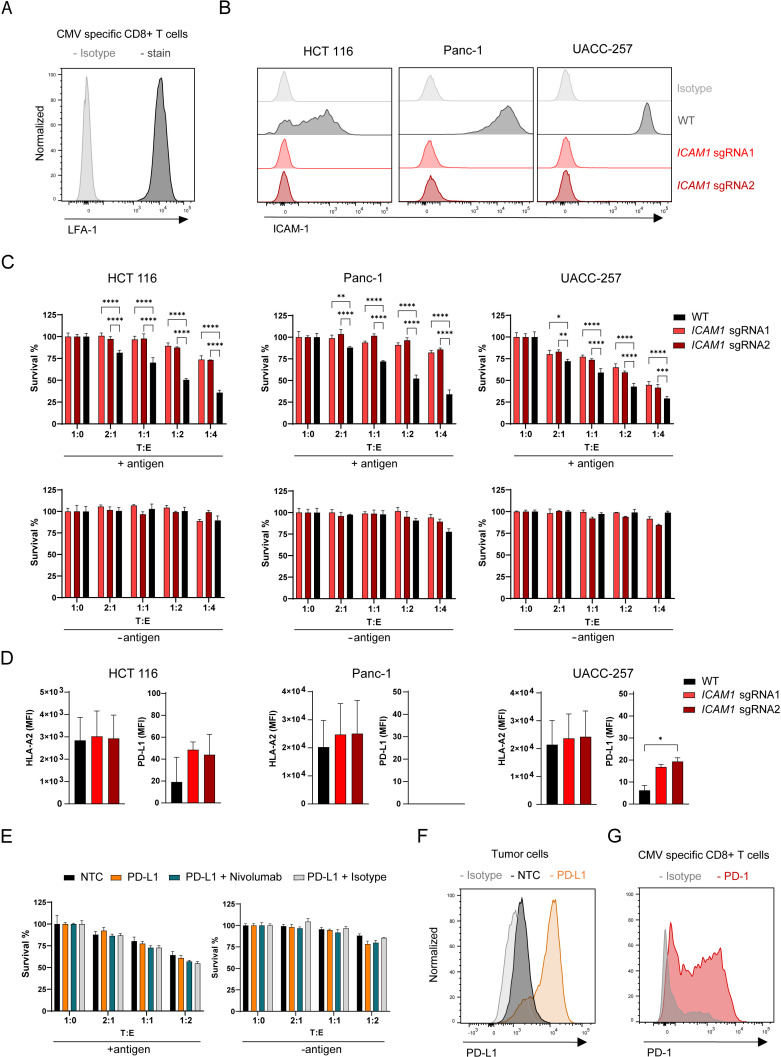
Figure 4. Depletion of ICAM1 induces tumor resistance to antigen-specific CTL killing.
(A) LFA-1 cell surface expression of CMV-specific CD8 + T cells measured by flow cytometry displayed as histogram (n=2). (B) Histograms showing ICAM-1 levels of HCT 116, Panc-1 and UACC-257 cell lines and respective KO pools after fluorescence activated cell sorting (n=3). (C) Cell survival of antigen loaded and untreated HCT 116, Panc-1, UACC-257 cells and ICAM1 KO pools using CRISPR KO and 2 sgRNAs cells against CTL killing after 3 days of co-culturing with different ratios of PBMCs containing antigen specific CTLs. Bar graphs show normalized mean ± SD of triplicate representative for two (Panc-1, UACC-257) or three (HCT-116) independent experiments. Two-way ANOVA corrected for multiple comparison according to Dunnett was used to determine statistical significance (*p<0.05, **p<0.01, ***p<0.001, ****p<0.0001). (D) Mean fluorescence intensities of HLA-A2 and PD-L-1 on the cell surface of HCT 116 WT or HCT 116 ICAM1 KO cells. Bar graphs show mean ± s.e.m (n=2). Unpaired two-tailed t test was used to determine statistical significance (*p<0.05). (E) Cell survival of untreated or antigen loaded HCT 116 and HCT 116 PD-L1 cells in the presence of Nivolumab or isotype with different ratios of PBMCs containing antigen-specific CTLs. Bar graphs show normalized mean ± s.e.m. in triplicate representative for two independent experiments. (F) Representative histogram of CRISPRa-induced PDL1 expression in HCT 116 cells (n=2). NTC = non-targeting control. (G) Representative histogram of PD-1 expression of stimulated CMV-specific CTLs (n=3).

