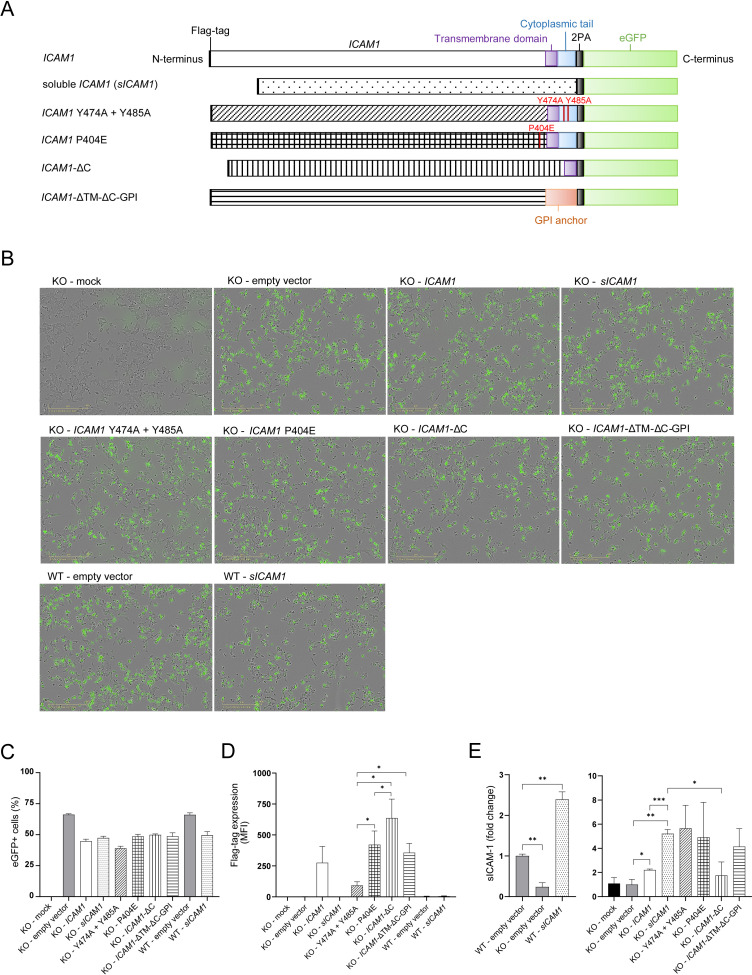
Figure 5. Design and expression of different ICAM-1 isoform eGFP-plasmids.
(A) Design of different ICAM1 isoforms carrying eGFP-plasmids. (B) Representative pictures of HCT 116 or ICAM1 KO cells transfected with ICAM-1-eGFP-plasmids. Pictures were obtained 20 hr after transfection with a 10 x objective using phase contrast channel as well as the green fluorescent channel (n=3). Scale bars, 400 μm. (C) eGFP + cells one day post transfection (dpt) measured by flow cytometry. Bar graphs show mean frequency ± s.e.m. (n=3). (D) Flag-tag level on the cell surface after 1 day of transfected cells measured by flow cytometry. Bar graphs show mean fluorescent intensity ± s.e.m. (n=3). (E) Fold change of sICAM-1 in the supernatant of transfected cells compared to WT (left) or KO (right) measured by IQELISA. Bar graphs show mean ± s.e.m. (n=3.). Two-tailed t tests with adjustments for multiple comparisons were performed (*p<0.05, **p<0.01, ***p<0.001).

