. 2023 Sep 21;12:e84314. doi: 10.7554/eLife.84314

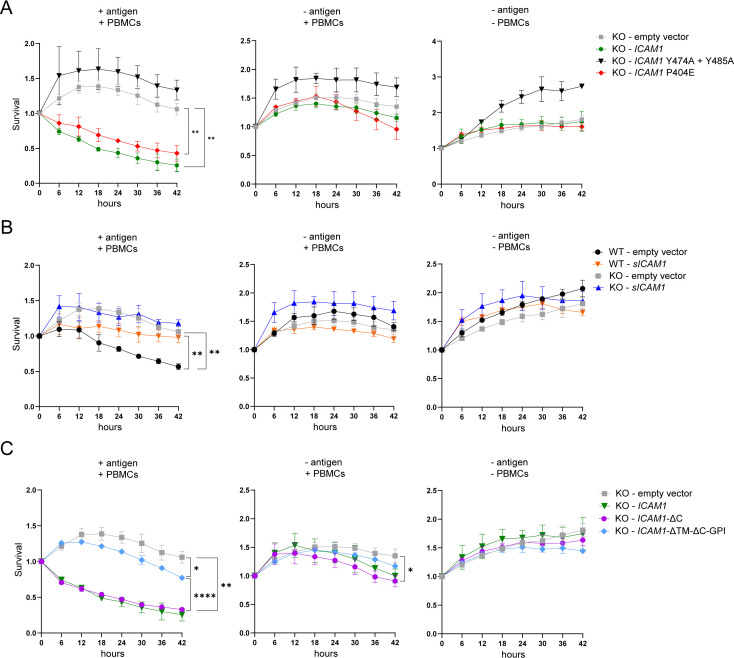
Figure 6. ICAM-1 isoforms differently regulate antigen-specific tumor cell killing by CTLs.

(A) Real time kinetic of tumor cell killing by PBMCs with T:E ratio of 1:4. HCT 116 ICAM1 KO cells were transfected with empty vector (gray), ICAM1 (green), ICAM1 Y474A+Y485 A (black) or ICAM1 P404E (red). (B) Real-time kinetic of tumor cell killing by PBMCs with T:E ratio of 1:4. WT or HCT 116 ICAM1 KO cells were transfected with empty vector (WT – black; KO – gray) or sICAM1 (WT – orange; KO – blue). (C) Real-time kinetic of tumor cell killing by PBMCs with T:E ratio of 1:4. HCT 116 ICAM1 KO cells were transfected with empty vector (gray), ICAM1- ΔC (purple), ICAM1-ΔTM-ΔC-GPI (light blue). Cell survival was determined counting green objects every 6 hours by using the IncuCyte system and normalized to timepoint zero. Conditions were performed in triplicate and four pictures of each triplicate were used for analysis (in total 12). Line graphs show mean ± SD for each timepoint representative for at least two independent experiments. Two-way ANOVA with Geisser-Greenhouse correction was used to determine statistical significance of each timepoint. Depicted stars represent statistical significance for t=42 hr (*p<0.05, **p<0.01, ***p<0.001, **** p<0.0001).

Figure 6—source data 1. Sequences of ICAM-1 isoform eGFP-plasmids.

Figure 6.

Figure 6—figure supplement 1. mICAM-1 levels measured by flow cytometry of HCT 116 cells transfected with full length ICAM-1, sICAM-1 or empty vector as control.
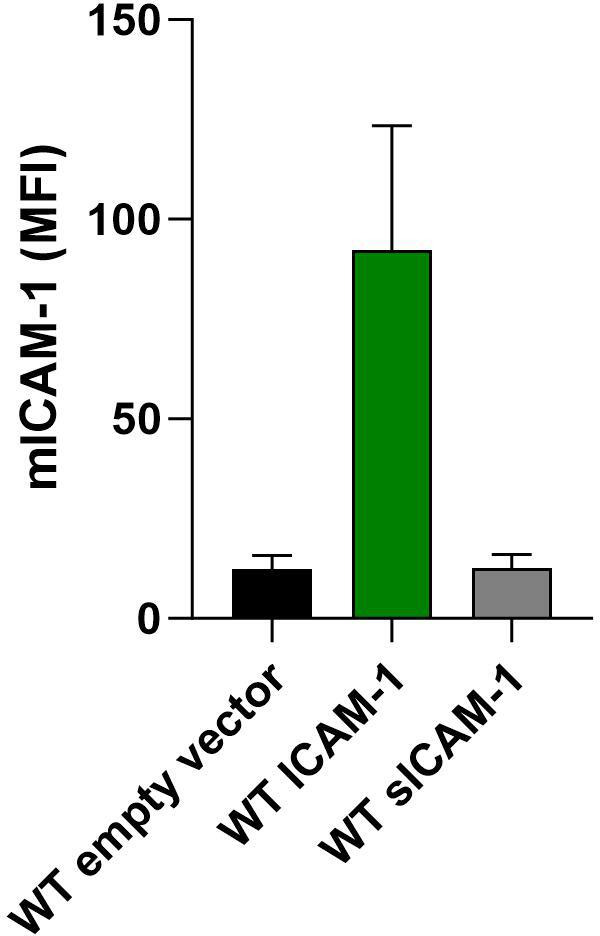
Figure 6—figure supplement 1.

Bar graphs show normalized mean ± s.e.m. of three independent experiments (n=3).
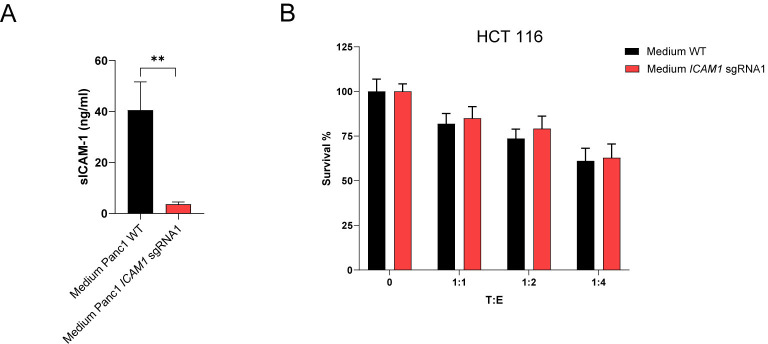
Figure 6—figure supplement 2. Media enriched with sICAM1 from stimulated Panc-1 cells does not protect HCT116 cells from CTL killing.

Figure 6—figure supplement 2.

(A) sICAM-1 levels of conditioned medium harvested from stimulated Panc-1 WT or ICAM1 KO cells. Bar graphs show normalized mean ± SD of three independent experiments. (B) Cell survival of antigen loaded HCT 116 cells against CTL killing either cultured in conditioned medium harvest from Panc-1 WT or ICAM1 KO cells after 3 days with different ratios of PBMCs containing antigen specific CTLs. Bar graphs show normalized mean ± SD of triplicate representative for or three independent experiments (n=3).
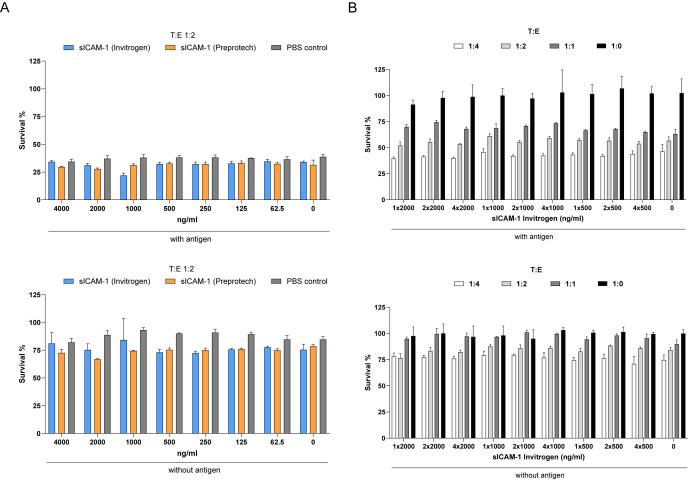
Figure 6—figure supplement 3. Addition of recombinant sICAM1 in media does not protect HCT 116 cells from CTL killing.

Figure 6—figure supplement 3.

(A) Cell survival of antigen loaded or untreated HCT 116 cells against CTL killing cultured in sICAM-1 (Invitrogen or Preprotech) conditioned medium as indicated after 3 days with a target:effector (T:E) ratio of 1:2. (B) Cell survival of antigen loaded or untreated HCT 116 cells against CTL killing in presence of different dosages given once or continuously over time of sICAM-1 (Invitrogen) after 3 days with different ratios of PBMCs containing antigen-specific CTLs. Bar graphs show normalized mean ± SD of triplicates.