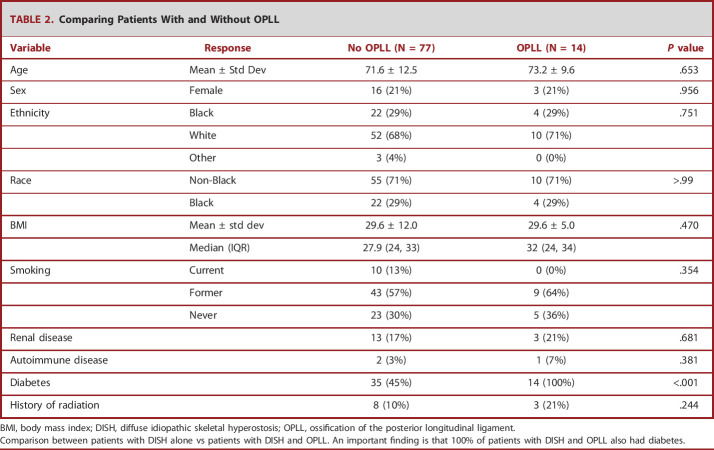
TABLE 2.
Comparing Patients With and Without OPLL
| Variable | Response | No OPLL (N = 77) | OPLL (N = 14) | P value |
|---|---|---|---|---|
| Age | Mean ± Std Dev | 71.6 ± 12.5 | 73.2 ± 9.6 | .653 |
| Sex | Female | 16 (21%) | 3 (21%) | .956 |
| Ethnicity | Black | 22 (29%) | 4 (29%) | .751 |
| White | 52 (68%) | 10 (71%) | ||
| Other | 3 (4%) | 0 (0%) | ||
| Race | Non-Black | 55 (71%) | 10 (71%) | >.99 |
| Black | 22 (29%) | 4 (29%) | ||
| BMI | Mean ± std dev | 29.6 ± 12.0 | 29.6 ± 5.0 | .470 |
| Median (IQR) | 27.9 (24, 33) | 32 (24, 34) | ||
| Smoking | Current | 10 (13%) | 0 (0%) | .354 |
| Former | 43 (57%) | 9 (64%) | ||
| Never | 23 (30%) | 5 (36%) | ||
| Renal disease | 13 (17%) | 3 (21%) | .681 | |
| Autoimmune disease | 2 (3%) | 1 (7%) | .381 | |
| Diabetes | 35 (45%) | 14 (100%) | <.001 | |
| History of radiation | 8 (10%) | 3 (21%) | .244 |
BMI, body mass index; DISH, diffuse idiopathic skeletal hyperostosis; OPLL, ossification of the posterior longitudinal ligament.
Comparison between patients with DISH alone vs patients with DISH and OPLL. An important finding is that 100% of patients with DISH and OPLL also had diabetes.

