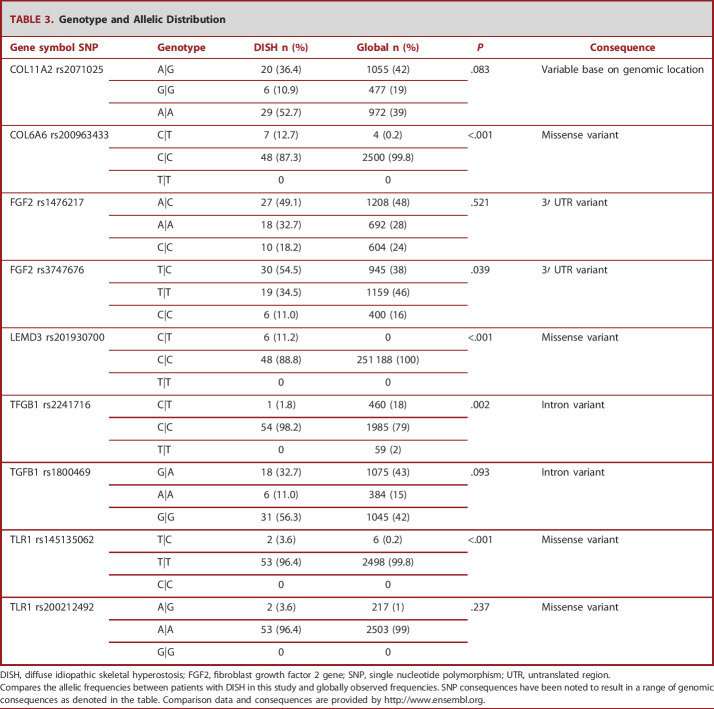
TABLE 3.
Genotype and Allelic Distribution
| Gene symbol SNP | Genotype | DISH n (%) | Global n (%) | P | Consequence |
|---|---|---|---|---|---|
| COL11A2 rs2071025 | A|G | 20 (36.4) | 1055 (42) | .083 | Variable base on genomic location |
| G|G | 6 (10.9) | 477 (19) | |||
| A|A | 29 (52.7) | 972 (39) | |||
| COL6A6 rs200963433 | C|T | 7 (12.7) | 4 (0.2) | <.001 | Missense variant |
| C|C | 48 (87.3) | 2500 (99.8) | |||
| T|T | 0 | 0 | |||
| FGF2 rs1476217 | A|C | 27 (49.1) | 1208 (48) | .521 | 3′ UTR variant |
| A|A | 18 (32.7) | 692 (28) | |||
| C|C | 10 (18.2) | 604 (24) | |||
| FGF2 rs3747676 | T|C | 30 (54.5) | 945 (38) | .039 | 3′ UTR variant |
| T|T | 19 (34.5) | 1159 (46) | |||
| C|C | 6 (11.0) | 400 (16) | |||
| LEMD3 rs201930700 | C|T | 6 (11.2) | 0 | <.001 | Missense variant |
| C|C | 48 (88.8) | 251 188 (100) | |||
| T|T | 0 | 0 | |||
| TFGB1 rs2241716 | C|T | 1 (1.8) | 460 (18) | .002 | Intron variant |
| C|C | 54 (98.2) | 1985 (79) | |||
| T|T | 0 | 59 (2) | |||
| TGFB1 rs1800469 | G|A | 18 (32.7) | 1075 (43) | .093 | Intron variant |
| A|A | 6 (11.0) | 384 (15) | |||
| G|G | 31 (56.3) | 1045 (42) | |||
| TLR1 rs145135062 | T|C | 2 (3.6) | 6 (0.2) | <.001 | Missense variant |
| T|T | 53 (96.4) | 2498 (99.8) | |||
| C|C | 0 | 0 | |||
| TLR1 rs200212492 | A|G | 2 (3.6) | 217 (1) | .237 | Missense variant |
| A|A | 53 (96.4) | 2503 (99) | |||
| G|G | 0 | 0 |
DISH, diffuse idiopathic skeletal hyperostosis; FGF2, fibroblast growth factor 2 gene; SNP, single nucleotide polymorphism; UTR, untranslated region.
Compares the allelic frequencies between patients with DISH in this study and globally observed frequencies. SNP consequences have been noted to result in a range of genomic consequences as denoted in the table. Comparison data and consequences are provided by http://www.ensembl.org.

