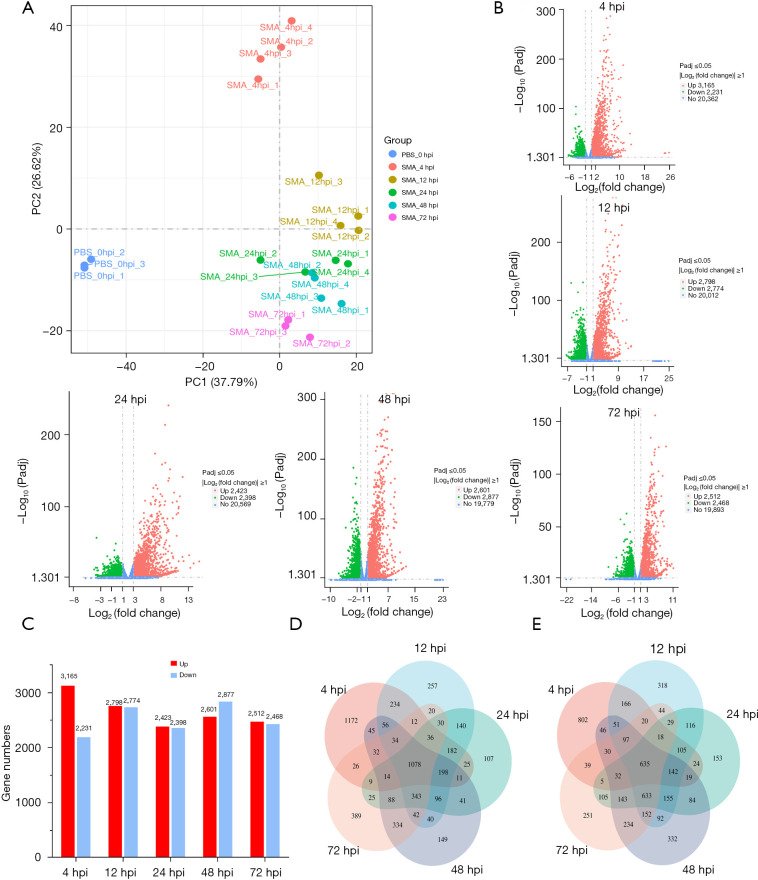
Figure 2.
Overview of time-course transcriptome analysis based on the FPKM levels of all groups. (A) Principal component analysis was performed on all samples based on gene expression (FPKM). (B) Volcano map of DEGs at different time points compared with the control group. (C) Different time points of DEG upregulation and downregulation. (D) Venn diagram showing up-regulated DEGs identified in different groups. (E) Venn diagram showing down-regulated DEGs identified in different groups. Each transcriptome analysis included 3–4 biological replicates. PC, principal component; PBS, phosphate-buffered saline; hpi, hours post-infection; SMA, Stenotrophomonas maltophilia; Padj, adjusted P value; FPKM, fragments per kilobase of transcript per million mapped reads; DEGs, differentially expressed genes.

