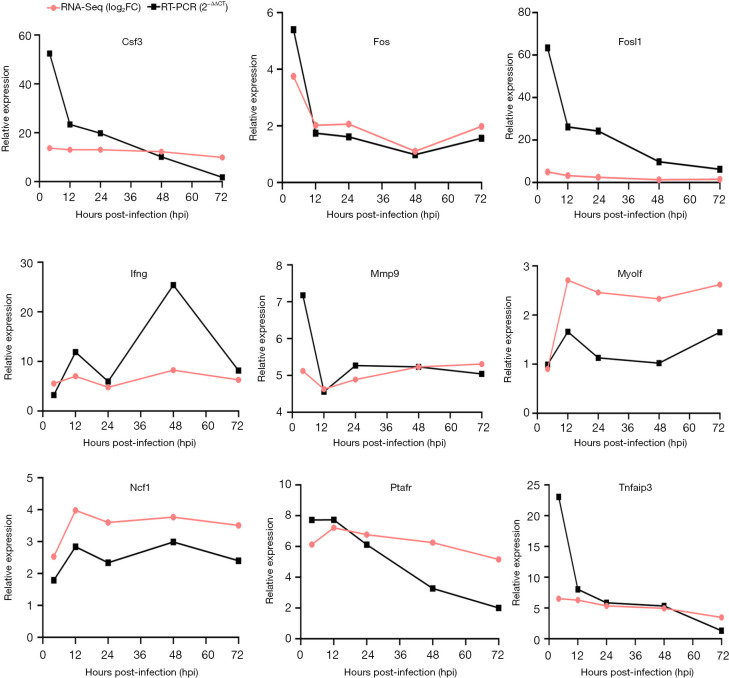
Figure 7.
qRT-PCR validation of RNA-seq data. Nine DEGs were chosen for validation, and the data showed a similar trend with RNA-seq data. The y-axis depicts the fold changes of various infection stages relative to the starting point, with positive values indicating upregulation and negative values indicating downregulation. Three biological replicates were used to obtain each data point. RNA-seq, RNA sequencing; FC, fold change; qRT-PCR, quantitative real-time polymerase chain reaction; hpi, hours post-infection; DEGs, differentially expressed genes.

