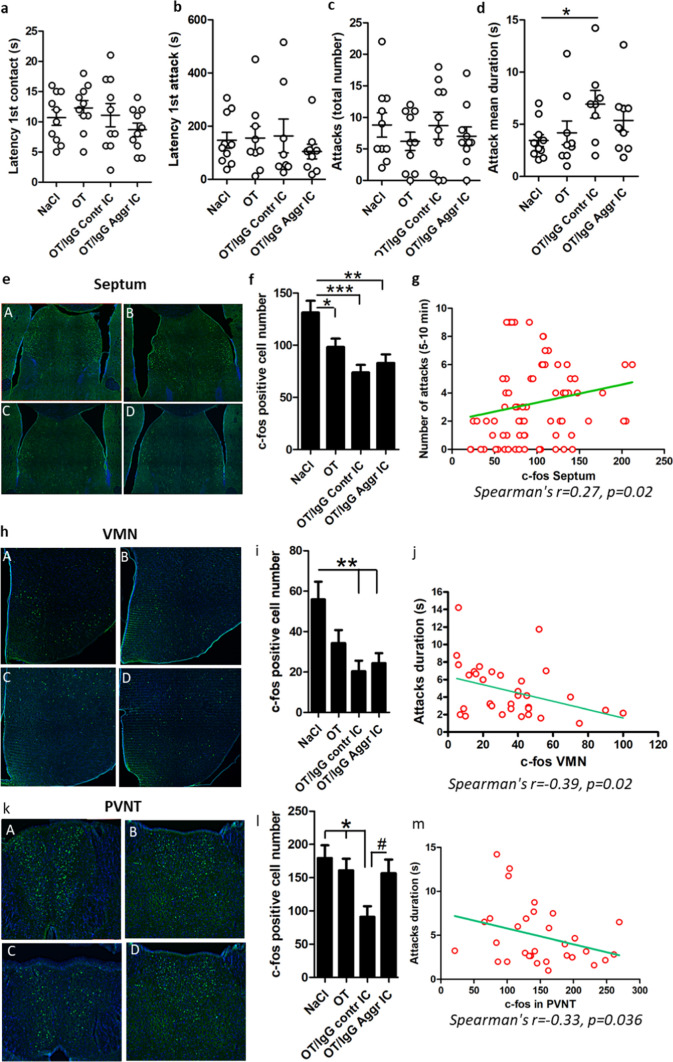
Fig. 4.
Resident intruder test (RIT) and brain c-fos immunohistochemistry in mice. a First contact latency. b First attack latency. c. Number of attacks. d Individual attack duration. Immunohistochemical detection of c-fos protein (green) in the brain after the RIT in the septum (e), ventromedial nucleus of the hypothalamus (VMN, h) and the paraventricular nucleus of the thalamus (PVNT, k), each panel subdivided in 4 images corresponding to the groups of 0.9% NaCl (A), OT (B), OT/IgG Contr IC (C) and OT/IgG Aggr IC (D). Quantification of c-fos positive cells in the septum (f) VMN (i) and PVNT (l). Significant Spearman’s correlations between c-fos-cell number and behavior are shown in g, j and m, in the septum (g) for number of attacks, and in VMN (j) and PVNT (m) for attack duration. Student’s t-test *p < 0.05 (d), ANOVA p < 0.0001 (f), p = 0.003 (i) and p = 0.009 (I), Tukey’s post-tests *p < 0.05, **p < 0.01 and ***p < 0.001, Student’s t-test #p < 0.05 (l). c-fos number (f, i, l) was calculated bi-laterally, n = 20

