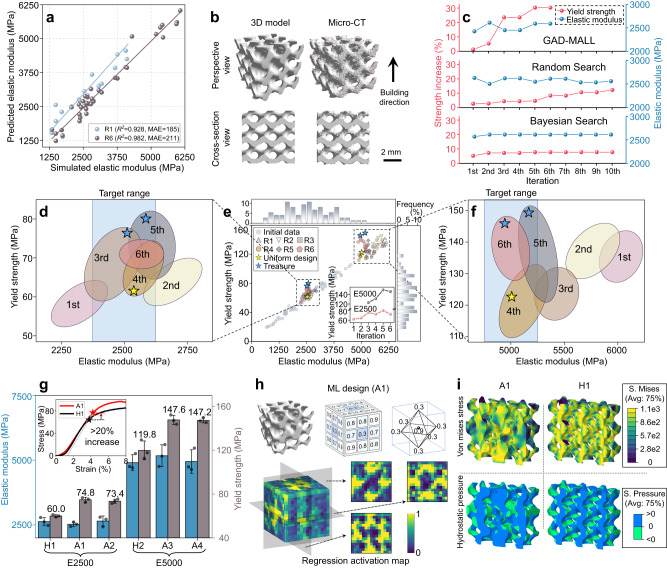
Fig. 2. Data-efficient learning of high-performance scaffolds.
a The regression plots (1st and last rounds of active learning) of the 3D convolutional neural networks (3D-CNNs) for elastic modulus (E). Both 3D-CNNs demonstrate excellent accuracy on the testing set, showing a low mean absolute error (MAE) and a high coefficient of determination (R2). b Micro-computed tomography (Micro-CT) shows that the designated scaffolds were accurately manufactured. c Baseline comparison of GAD-MALL (Generative Architecture Design—Multi-objective Active Learning Loop) with random-search and Bayesian optimization. d, e, f The overall finite element method (FEM) simulation data distribution in terms of the E-yield strength (Y) plot. The inset of e shows the maximal Y-values corresponding to structures designed in each iterative round while concurrently meeting the predefined target E range. Initial data points are marked as light blue dots. Six rounds of active learning data points are represented by various symbols (R1–R6). The uniform design and GAD-MALL treasure points are marked as golden and blue stars, respectively. The colored ellipses represent the area covered by 6 rounds of active learning data. The blue shaded area indicates the target range of E (i.e., target E-value ± 5%). g Comparison of the experimental E and Y between machine-learning (ML)-designed (A1, A2 for E2500 and A3, A4 for E5000) and uniform-designed (H1 for E2500, H2 for E5000) scaffolds. The inset shows the experimental strain‒stress curves of the A1 and H1 scaffolds. The dashed line within the inset is derived by translating the linear segment of the stress-strain curve horizontally by a 0.2% strain offset and is used to obtain the yield points of the curves. The Y of the ML-designed scaffolds was obviously higher than that of the uniform designs. Data are presented as mean values ± SD, n = 3. h The upper figures show the mathematical model of the A1 scaffold and its porosity matrix. The lower figures contain the 3D view and three cross-section views of the regression activation map (RAM). The RAM reveals a “face-centered” lattice in the A1 scaffold, implying its prominent role in enhancing Y. This face-centered lattice is displayed in the upper right part of the figure. i Numerical compression analysis. Here, we show the y–z cross-sections of A1 and H1 scaffolds in terms of von Mises stress and hydrostatic pressure under 10% deformation. Source data are provided as a Source Data file.

