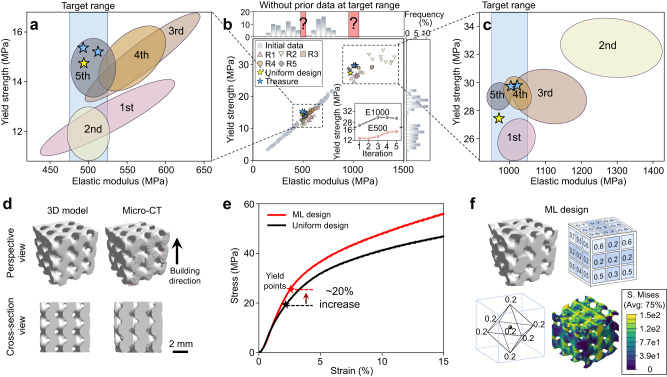
Fig. 3. Learning without prior data at the target range.
a, b, c The elastic modulus (E)—yield strength (Y) distribution of finite element method (FEM) simulation results. The inset of b shows the maximal Y-values corresponding to structures designed in each iterative round while concurrently meeting the predefined target E range. Initial data points are marked as light blue dots. Five rounds of active learning data points are represented by various symbols (R1–R5). The uniform design and GAD-MALL treasure points are marked as golden and blue stars, respectively. The colored ellipses represent the area covered by 5 rounds of active learning data. The blue shaded area indicates the target range of E (i.e., target E-value ± 5%). d Micro-computed tomography (Micro-CT) shows that the designated Zn scaffolds were manufactured with good precision. e The experimental strain‒stress curves of the machine learning (ML) and uniform-designed scaffolds. The ML design yielded a 20% increase in Y. f The porosity of the ML-designed scaffold reached the lower limit (0.2) at the face centers and the center of the scaffold. Similar to the ML-designed Ti scaffold, the compression analysis shows that the low-porosity units of the ML-designed Zn scaffold had lower stress concentrations. Source data are provided as a Source Data file.

