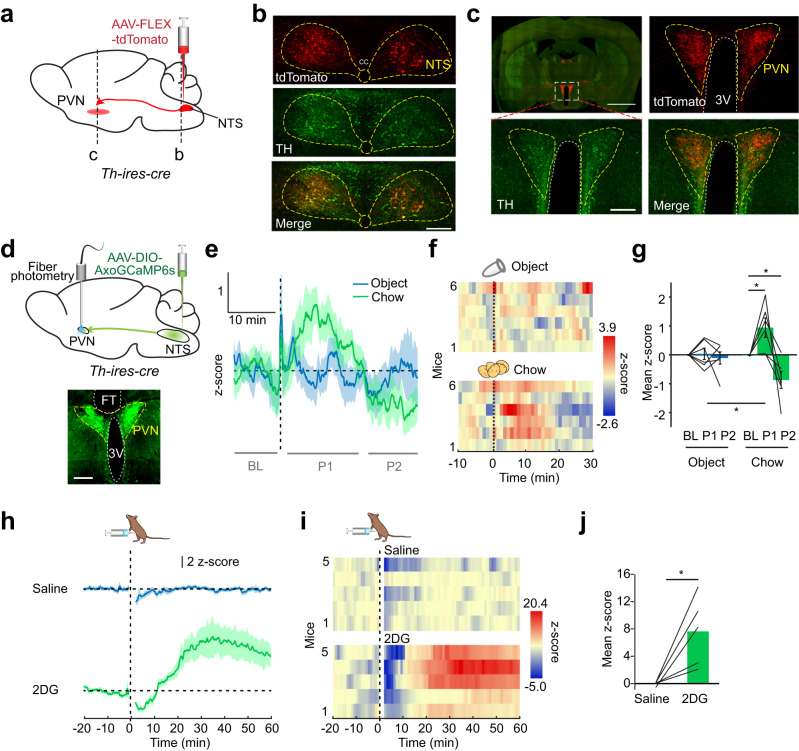
Fig. 2. NTSTH → PVN projection responds to feeding and glucoprivation.
a Schematic for mapping NTSTH projections in the PVN. b Photomicrographs showing fluorescent reporter, tdTomato (red) and anti-TH stained (green) NTS somas. Scale bar: 100 μm. c Visualization of PVN innervation by TH positive (green) NTSTH fibers (red). Note that in addition to incoming TH+ axons, local TH-expressing soma in PVN is also labeled with TH staining. Scale bars: 2 mm and 200 μm. d Schematic for fiber photometry recording of NTSTH → PVN axonal activity with Axon-GCaMP6s. Scale bar: 200 μm. e–g NTSTH:AxoGCaMP6s → PVN response to control object and chow in food restricted animals. e average traces, f individual temporal heatmaps, and g quantification at indicated timepoints (n = 6 mice, 2-way RM ANOVA with Tukey’s and Sidak’s multiple comparisons, *p < 0.05). h–j NTSTH:AxoGCaMP6s → PVN fluorescent response to intraperitoneal saline and 2DG (450 mg/kg) administration, h average traces, i individual temporal heatmaps, and j quantification of mean z-scores (15–60 min, n = 5 mice, two-tailed, paired t-test, *p = 0.028). Data are presented as mean values +/− SEM. For specific data, p-values and statistics, please see associated Source data file.

