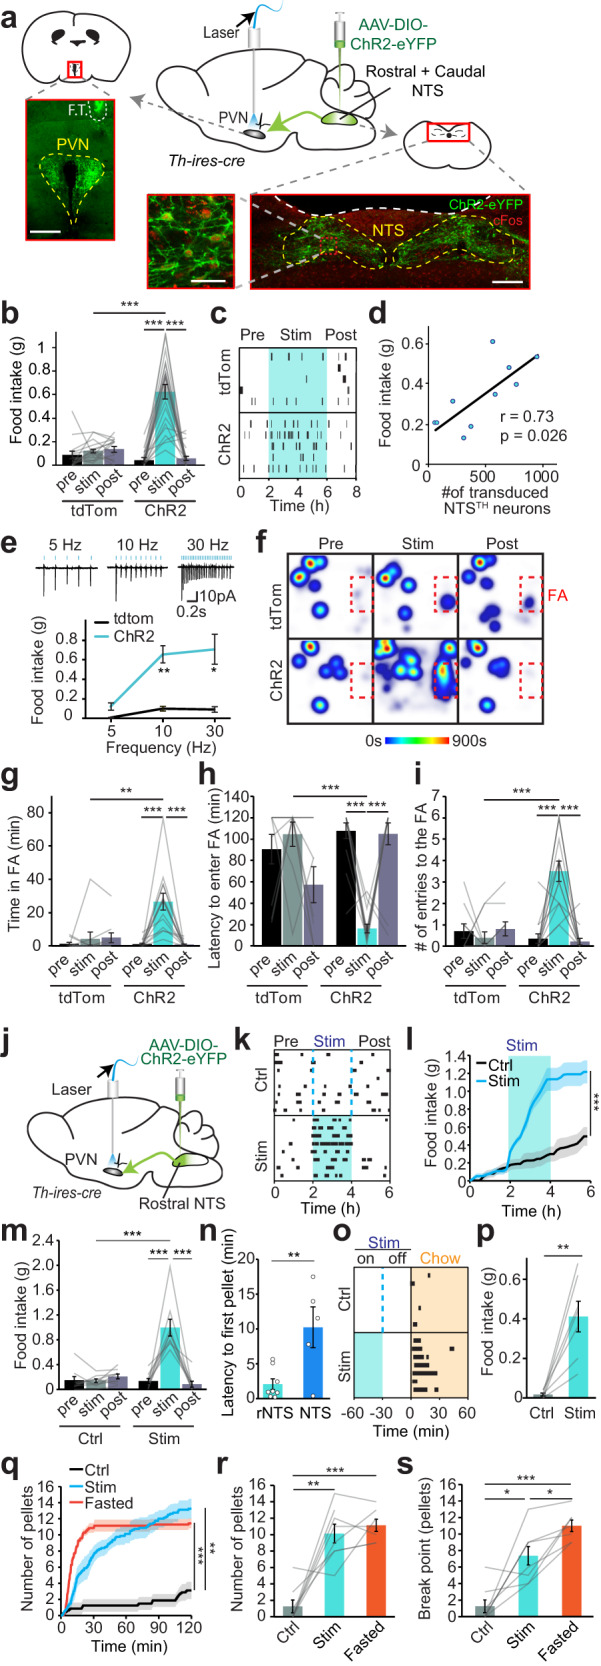
Fig. 3. NTSTH → PVN projection evokes feeding.

a Schematic and representative images of ChR2 expression in NTSTH-neurons of Th-ires-cre mice, showing PVN innervation by NTSTH:ChR2 axons (top left, F.T.: fiber tract, scale bar 300 μm) and transduced TH-neurons expressing ChR2 (green) and cFos (red) in NTS (bottom, scale bars: 300 μm and 50 μm). b Average 2-h food intake during baseline (pre), optogenetic stimulation (stim), and post-stimulation (post) periods in control (tdTomato, n = 15) and ChR2 transduced mice (n = 23, 2-way RM-ANOVA, ***p < 0.0001). c Temporal raster plot of food pellets consumed during experiment in tdTomato and ChR2 expressing mice (n = 5 each). d Two-tailed Pearson correlation between number of ChR2 transduced NTSTH-neurons and food consumption (n = 10). e Top: Representative cell-attached recordings from NTSTH-neurons with 5, 10, and 30 Hz optogenetic stimulations in acutely prepared slices. Bottom: Food intake during NTSTH → PVN photoactivation at different stimulation frequencies (n = 5 tdTomato, n = 7 ChR2 mice, 2-way RM-ANOVA, *p = 0.025, **p = 0.0022). f Cumulative heat maps depicting time spent in different locations of the behavioral cage during NTSTH → PVN photostimulation (FA: food area). g–i Quantification of (g) time spent in, (h) latency to enter, and (i) number of entries to the FA in tdTomato (n = 10) and ChR2 (n = 14) cohorts (2-way RM-ANOVA, ***p < 0.0001, **p = 0.0066). j Schematic for selective photoactivation of rostral NTSTH (rNTSTH) neuronal axons over PVN. k–m Temporal raster plot (k), cumulative (l, n = 9, two-tailed, paired t-test, ***p = 0.0008) and total average feeding (m, n = 9 mice, 2-way RM-ANOVA, ***p < 0.0001) in response to 2-h rNTSTH → PVN photostimulation during light cycle. n Summary graph showing latency to first pellet in response to rNTSTH → PVN versus NTSTH → PVN photostimulation (n = 5 NTS, 8 rNTS, two-tailed, unpaired t-test, **p = 0.0067). o, p Raster plot (o) and summary graph (p) showing delayed feeding 30 min after rNTSTH → PVN photostimulation is over (stimulation duration: 30 min, control: no stimulation n = 7 mice, two-tailed paired t-test, **p = 0.0022). q–s Progressive ratio task by nose-poke induced pellet delivery in response to 2-h rNTSTH → PVN potostimulation. Cumulative graph showing acquired pellets (q) under photostimulated (stim), non-stimulated (ctrl) and fasted conditions. Average number of pellets earned in 1 h (r) and 10 min nose-poke break points (s, n = 8 ctrl and stim, n = 7 fasted mice, One-way ANOVA, *p < 0.032, **p < 0.0033, ***p < 0.001). Data are presented as mean values +/− SEM. For specific p-values, data and statistics, please see associated Source data file.
