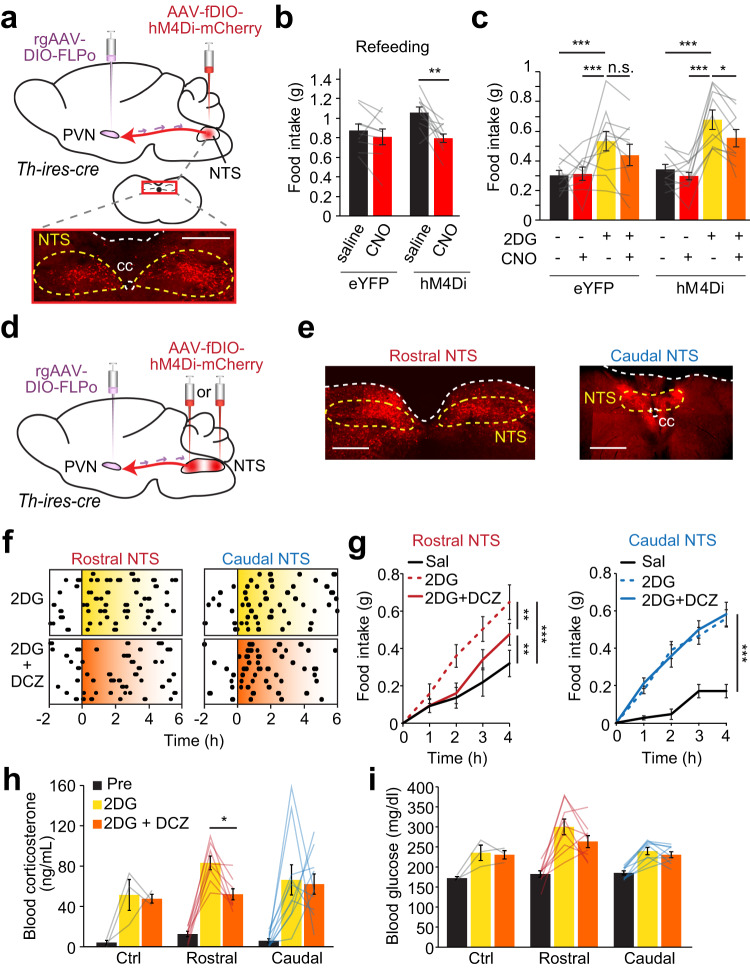
Fig. 4. NTSTH → PVN connection contributes to fasting-induced and glucoprivic feeding.
a Injection diagram for hM4Di-mediated (red) inhibition of PVN-projecting NTSTH neurons and photomicrograph showing transduced NTS neurons (scale: 500 μm). b Effect of control (saline) injection and chemogenetic (CNO) NTSTH → PVN silencing on 1-h food consumption following overnight food deprivation in control eYFP (n = 9 mice) and hM4Di (n = 10 mice) animals (2-way RM ANOVA with Sidak’s multiple comparison, **p = 0.0014). c Effect of NTSTH → PVN inhibition on 2DG-induced feeding in ad libitum fed control eYFP (n = 10) and hM4Di (n = 10) mice (4-h feeding, 2-way RM-ANOVA with Benjamini-Hochberg correction, *p = 0.035, ***p < 0.0007, n.s.: p = 0.112, Effect sizes: D = 0.639 (Δ (2DG – Baseline) of Control vs Rostral; D = 0.813 (Δ (2DG:CNO – 2DG) of Control vs Rostral). d Schematic for hM4Di transduction in PVN-projecting TH neurons in the rostral or caudal NTS. e Representative image of hM4Di (red) expression in PVN-projecting catecholaminergic neurons in the rostral and caudal NTS (scale: 500 μm). f Temporal raster plots of food pellets dispensed before and after intraperitoneal 2DG or 2DG + DCZ administration from mice expressing hM4Di in rostral (n = 10 mice) or caudal (n = 10 mice) NTSTH → PVN neurons. g Summary graph for cumulative 4-h food intake following intraperitoneal saline, 2DG, and 2DG + DCZ delivery from mice expressing hM4Di in PVN-projecting rostral (n = 10 mice) or caudal (n = 10 mice) NTSTH neurons (2-way RM-ANOVA with Tukey’s multiple comparison, ***p < 0.0001, **p < 0.0039). h, i Effects of 2DG alone or 2DG + DCZ on circulating corticosterone (h) and glucose (i) in control (n = 3 mice) and animals with hM4Di expression in rostral (n = 8 mice) or caudal (n = 10 mice) NTSTH → PVN neurons (One-way RM-ANOVA with Tukey’s multiple comparison, *p = 0.0159, Effect sizes: D = 0.987 (Δ (2DG – Baseline) of Control vs Rostral; D = 0.977 (Δ (2DG:DCZ – 2DG) of Control vs Rostral; Effect sizes: D = 0.291 (Δ (2DG-Baseline) of Caudal vs Rostral; D = 0.490 (Δ (2DG:DCZ – 2DG) of Caudal vs Rostral). Data are presented as mean values +/− SEM. For specific p-values, data and statistics, please see associated Source data file.

