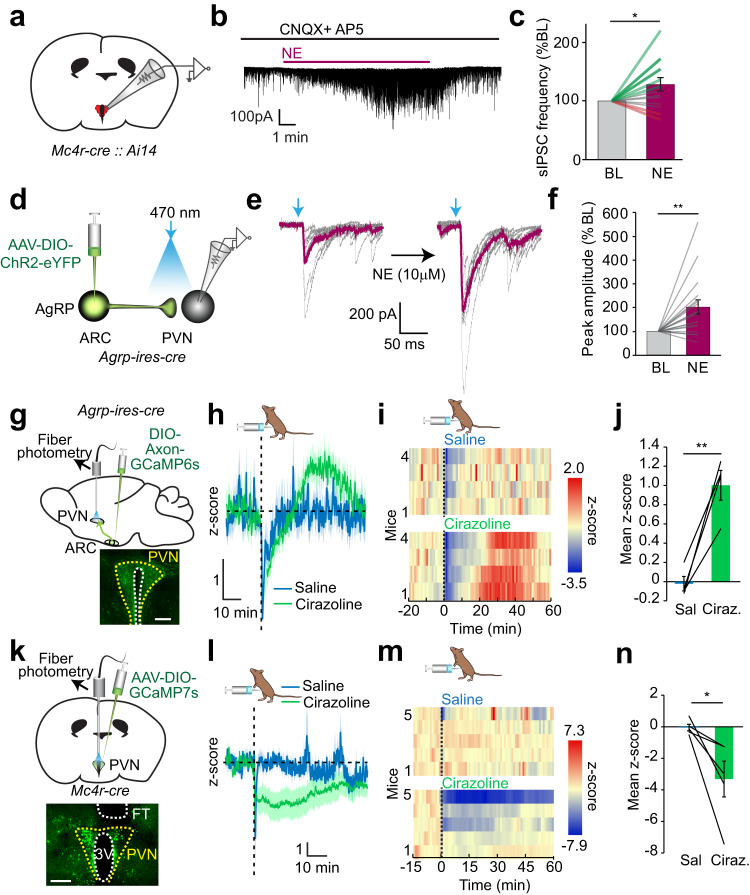
Fig. 6. Nor/adrenergic modulation of inhibitory ARCAgRP → PVN connection at the presynaptic terminal.
a Schematic for fluorescence-guided patch clamp recording from genetically tdTomato labeled PVNMC4R neurons. b Representative sIPSC trace from a PVNMC4R neuron treated with NE. c Relative change in sIPSC frequency during baseline (BL) and after NE application (n = 14 cells, 5 mice, two-tailed paired t-test, *p = 0.028). d Schematic for electrophysiological assessment of ARCAgRP → PVN eIPSC connection strength with ChR2-eYFP. e Individual (black) and average (purple) light-evoked ARCAgRP → PVN eIPSC before and after NE bath application. f Relative amplitude of light-evoked ARCAgRP → PVN eIPSC after NE application (n = 16 neurons, 6 mice, two-tailed, paired t-test, **p = 0.0036). g Schematic for recording in vivo ARCAgRP → PVN projection activity with Axon-GCaMP6s and representative image of Axon-GCaMP6s expressing ARCAgRP axons in the PVN (scale bar: 200 μm). h–j Effect of intraperitoneal cirazoline (0.5 mg/kg) administration on ARCAgRP → PVN axonal Ca2+ content (n = 4 mice). h Average traces, i temporal heatmaps from individual mice, and j quantification of mean z-score value from 20–50 min (two-tailed paired t-test, **p = 0.0074). k Schematic for in vivo GCaMP7s monitoring of PVNMC4R activity and representative image of GCaMP7s expression (scale bar: 250 μm). l–n Effect of intraperitoneal cirazoline administration on PVNMC4R GCaMP7s fluorescence (n = 5 mice). l Average traces, m individual temporal heatmaps, and n quantification of mean z-score values (two-tailed paired t-test, *p = 0.040). Data are presented as mean values +/− SEM. For specific p-values, data and statistics, please see associated Source data file.

