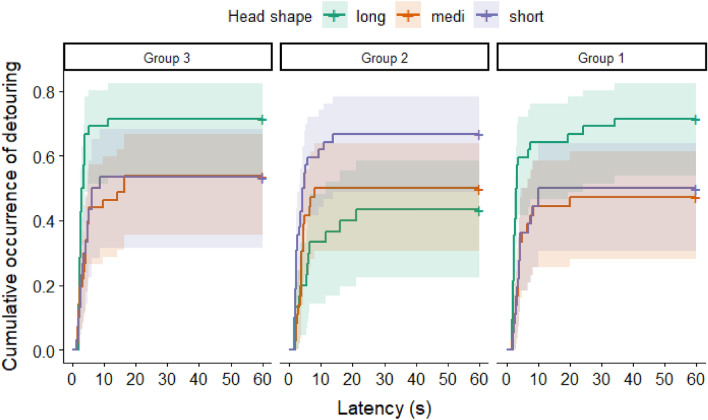
Figure 6.
Proportion of dogs at a given latency, who performed a detour in the case of the open small or large door, in the three Groups, respectively. Designations of the groups indicate how many trials the dogs had to perform with closed doors and then which door was open in the next trial. Group 1 = three closed door trials, then large door is open; Group 2 = one closed door trial, then large door is open; Group 3 = one closed door trial, then small door is open. In order to visualize the results, the otherwise continuous CI score was divided at the 33rd and 67th percentiles. Different colors mark different lengths of the head. Shading: ± 95% CI.

