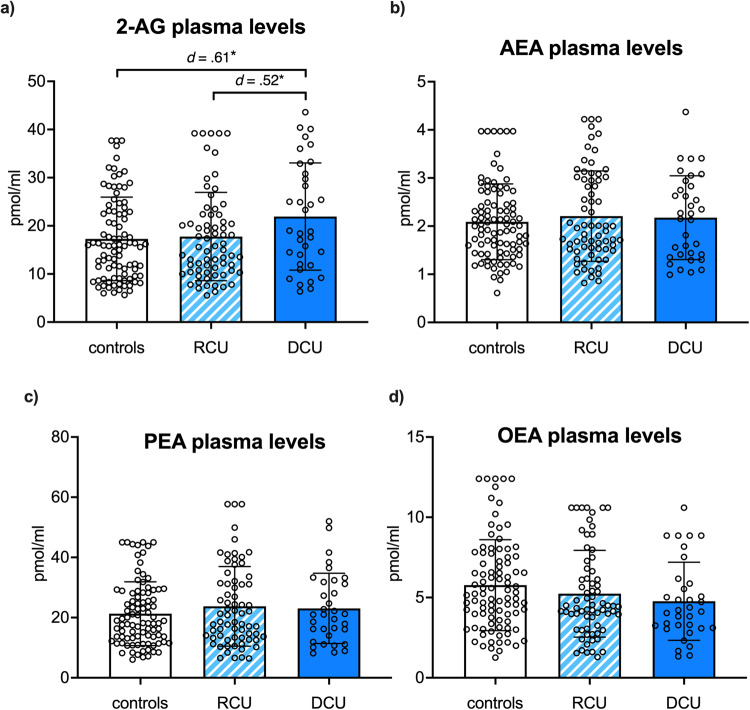
Fig. 1. Group differences in eCB/NAE plasma levels.
Dependent CU (DCU; dark blue) showed elevated basal plasma levels of a 2-arachidonylglycerol (2-AG) compared to controls (white) and recreational CU (RCU; light blue striped), whereas no group differences were found for b anandamide (AEA) c palmitoylethanolamide (PEA) d oleoylethanolamide (OEA). Bars represent means including individual data points, and error bars reflect standard error of the mean (SEM); corrected for age, sex, recent cannabis use, and alcohol dependence. Significant p-values marked with p < 0.05*, p < 0.01**.

