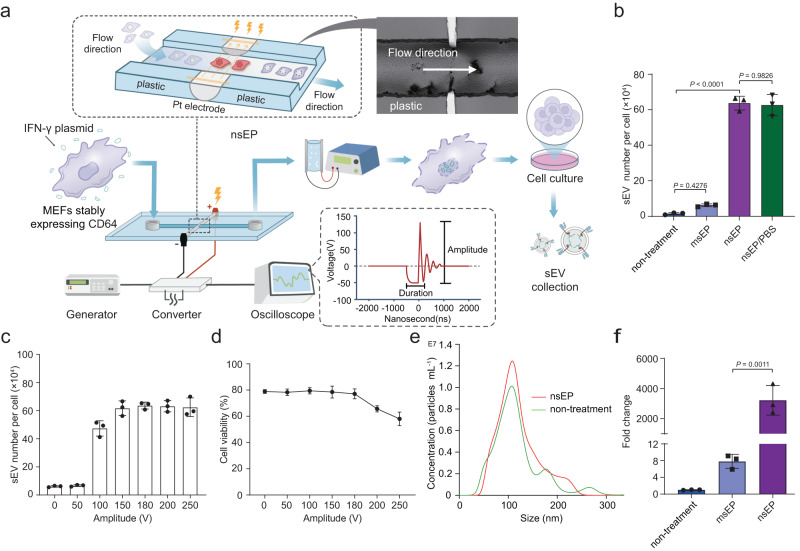
Fig. 2. Large-scale generation of sEVs by a nsEP system.
a Schematic representation of the nsEP system for sEV generation. b The sEV number per cell produced by mouse embryonic fibroblasts (MEFs) in untreated control, microsecond electroporation pulses (msEP), nsEP, and nsEP/PBS treatment groups. The total amount of sEVs = concentration of sEVs × volume. The number of viable cells was calculated by trypan blue staining and cell counting. The number of sEVs produced per cell = total number of sEVs/number of living cells. c Number of sEVs produced per MEF after nsEP system at voltage amplitudes from 0 to 250 V. d Viability of MEFs after nsEP system at voltage amplitudes from 0 to 250 V. e Size measurements and size distribution of sEVs produced by both the nsEP system (red) and the untreated control (green) cells. f RT-qPCR of IFN-γ mRNA revealed that sEVs produced by nsEP treatment contained much larger quantities of transcribed mRNAs than sEVs produced by other methods. Data in b–f are presented as means ± standard deviation (SD), n = 3 biologically independent samples; statistical significance was calculated by one-way analysis of variance with Tukey’s multiple comparisons test. Source data are provided as a Source Date file.

