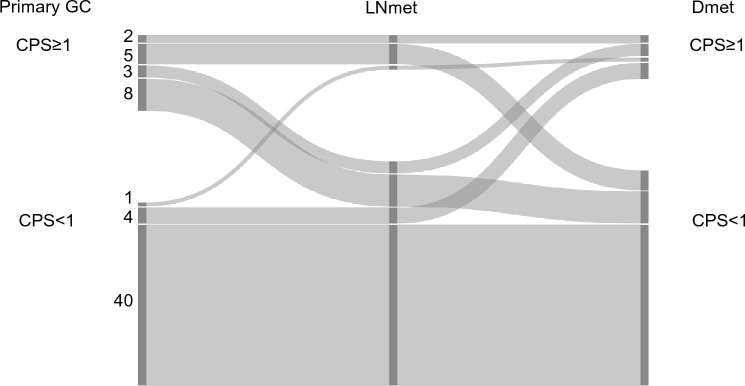
Fig. 3.
Combined positive score (CPS) cut-off 1 in matched primary gastric adenocarcinoma (GC), lymph node metastasis (LNmet) and distant metastasis (Dmet) (n = 63). Sankey plot showing the change in CPS between matched samples scored using CPS cut-off 1. The left side of the diagram shows the number of primary GC cases with CPS ≥ 1 or CPS < 1. The right side of the diagram shows the number of matched LNmet and Dmet with CPS ≥ 1 or CPS < 1. Ribbons connect matched samples

