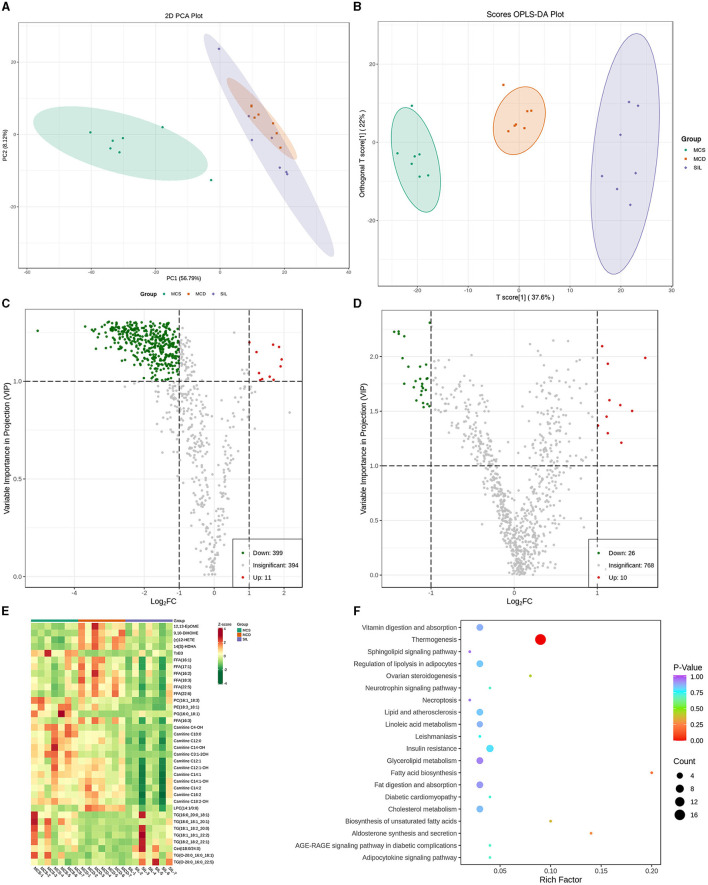
Figure 4.
Differential lipid species among MCS, MCD, and SIL groups (n = 7). (A) PCA score plot. (B) OPLS-DA score between MCS, MCD, and SIL groups. (C) Volcano plots of lipid species between MCD group and MCS group. (D) Volcano plots of lipid species between MCD group and SIL group. (E) Heat map for hierarchical cluster analysis of differential lipids. (F) KEGG pathway enrichment analysis of 36 differential lipids between MCD group and SIL group.

