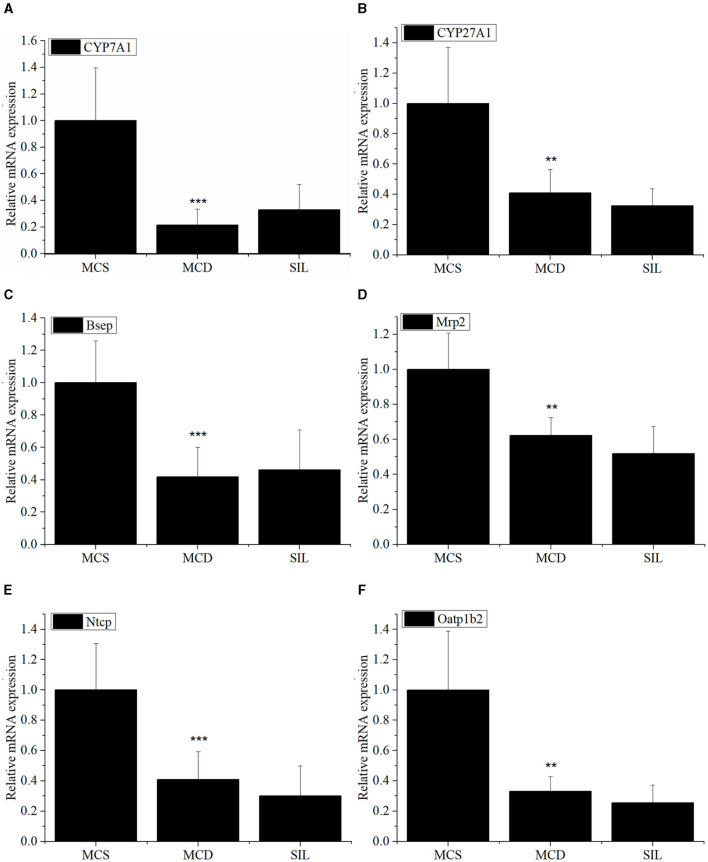
Figure 5.
Effects of SIL on the mRNA expression of BA metabolism-related genes CYP7A1 (A), CYP27A1 (B), Bsep (C), Mrp2 (D), Ntcp (E), and Oatp1b2 (F) in livers of the tested mice. The mRNA expression was analyzed by RT-qPCR and normalized to amplified β-actin. Data were expressed as mean ± SD (n = 7). *p < 0.05, **p < 0.01 vs. MCS group. ***p < 0.01 indicates statistically significant between MCS and MCD group.

