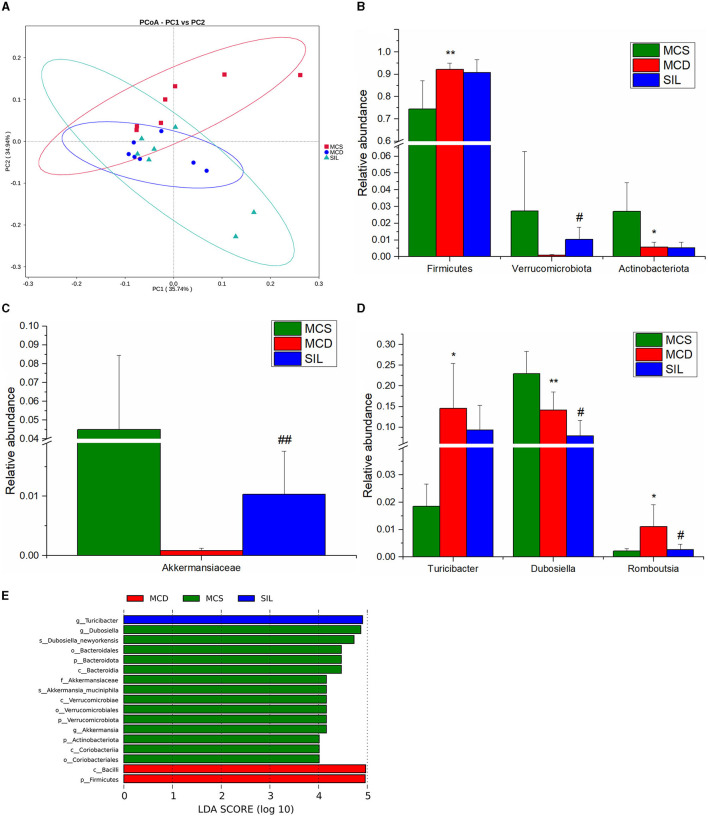
Figure 6.
Effects of SIL on the composition of gut microbiota in tested mice (n = 7). (A) PCoA plot of gut microbiota based on weighted Unifrac metric. (B) Differential microbiota composition at the phylum level. (C) Differential microbiota composition at the family level. (D) Differential microbiota composition at the genus level. (E) LDA bar plot of LEFSe analysis on gut microbiota. *p < 0.05, **p < 0.01 indicate statistically significant between MCS and MCD group. #p < 0.05, ##p < 0.01 indicate statistically significant between MCD and SIL group.

