
FIGURE 2.
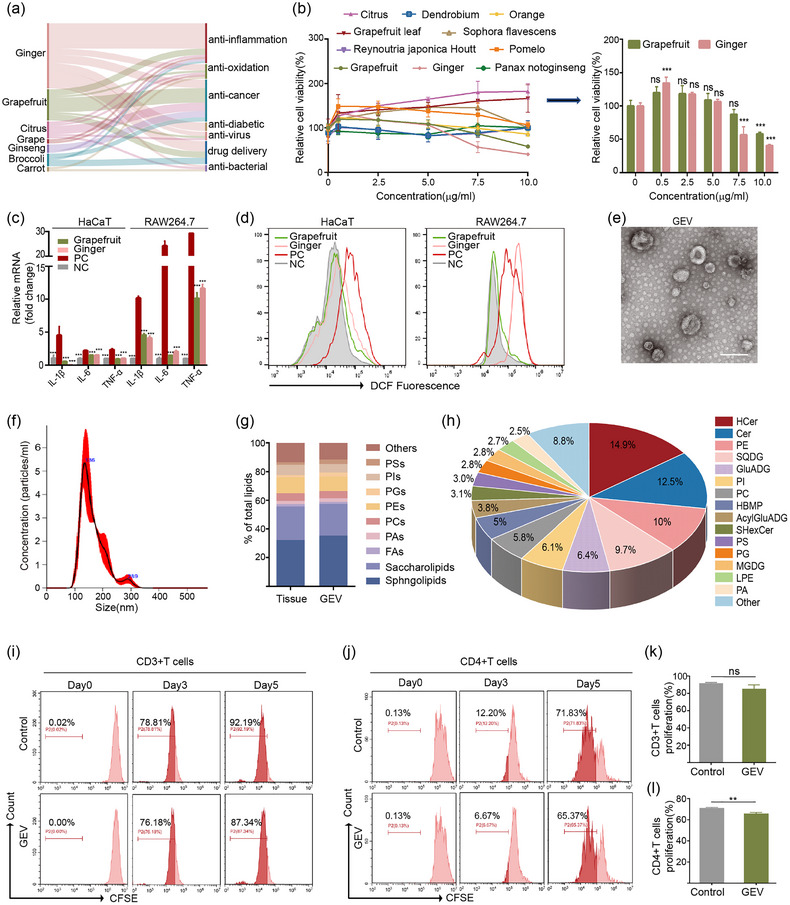
Grapefruit EVs had anti‐inflammatory and antioxidant effects. (a) Sankey plot showing PLEVs (left) with various therapeutic functions (right) via bibliometrics. (b) Cell viability curve of LPS‐stimulated HaCaT cells treated with the indicated different PLEVs (n = 3). (c) mRNA expression of IL‐1β, IL‐6 and TNF‐α in LPS‐induced HaCaT cells and RAW264.7 cells (n = 3). NC, cells without LPS treatment. (d) Flow cytometric analysis of intracellular ROS levels in LPS‐stimulated HaCaT cells and RAW264.7 cells treated with grapefruit‐derived nanovesicles (Grapefruit), and ginger‐derived nanovesicles (Ginger), respectively. (e,f) Representative TEM image and size distribution of GEVs. Scale bar: 200 nm. (g) Distribution of major types of lipids in grapefruit tissue and GEV. PAs: phosphatidic acids; PCs: phosphatidylcholines; PEs: phosphatidylethanolamines; PSs: phosphatidylserines; PIs: phosphatidylinositols; FAs: fatty acids. (h) Lipid composition of GEV. HCer: hexosylceramide; Cer: ceramide. (i–l) Flow cytometry analysis and corresponding quantitative analysis of CFSE‐labelled CD3+ or CD4+ T cells treated with GEV for 5 days (n = 3). Error bar, mean ± SD. n.s represents no significant, **P < 0.01; ***P < 0.001.