
FIGURE 3.
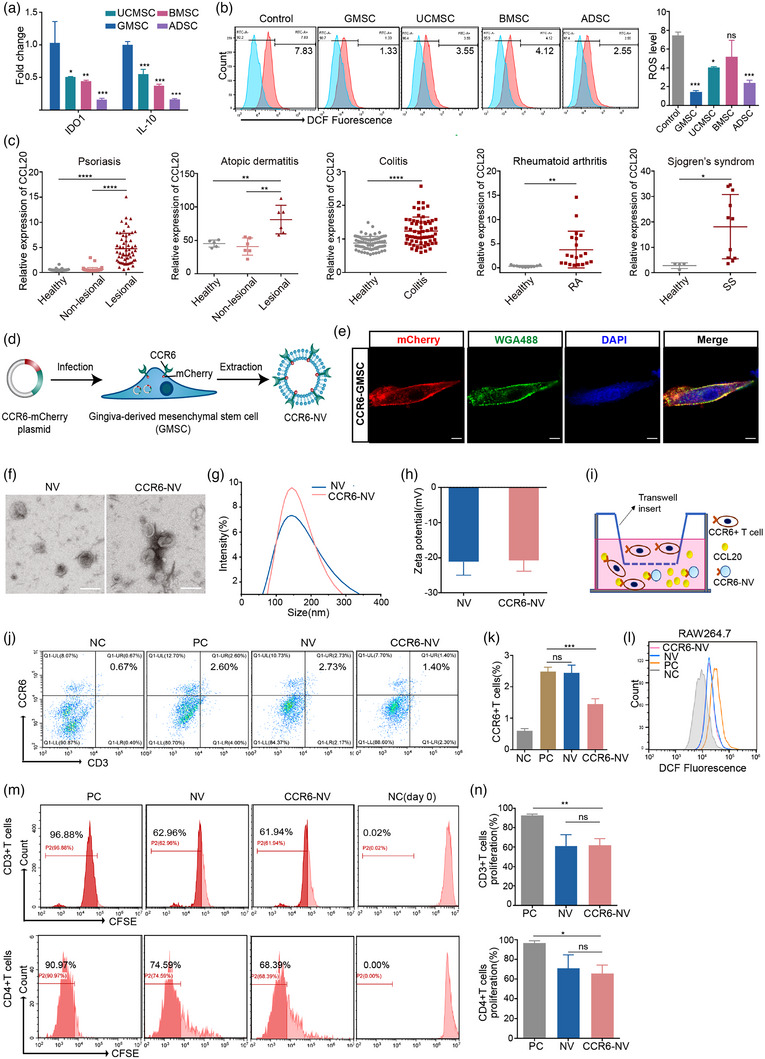
Characterizations of CCR6‐NVs derived from GMSCs. (a) mRNA expression of IDO1 and IL‐10 in NVs from different stem cells (n = 3). (b) Flow cytometric analysis of intracellular ROS levels in RAW264.7 cells pretreated with LPS for 12 h, then treated with indicated PBS or different NVs. (c) GEO data analysis of CCL20 gene expression in skin punch biopsies of psoriasis patients (GDS4602), skin biopsies of atopic dermatitis (AD) patients (GDS2381), colon epithelial biopsies of ulcerative colitis patients (GDS3268), synovial fluid mononuclear cells of rheumatoid arthritis patients (GDS711), and minor salivary glands of Sjogren's syndrome (SS) patients (GDS3940). (d) Schematic diagram of the preparation of CCR6‐NV. (e) Representative confocal images of CCR6 expression on GMSC cell membranes. Scale bar: 10 μm. (f–h) Representative TEM image, zeta potential, size distribution of control NVs and CCR6‐NVs. Scale bar: 200 nm. (i) Schematic illustration of transwell transmigration assay. Mouse lymphocytes were seeded in the upper chamber of the transwell apparatus and serum‐free culture medium containing PBS (NC) or CCL20 recombinant protein in a concentration gradient (PC) was added to the basolateral chamber. After 3 h of co‐culture of NVs or CCR6‐NVs at 37°C, the migrated cells were harvested from the basolateral chamber and counted by flow cytometry. (j,k) Flow cytometric analysis of transmigrated cells and corresponding quantitative analysis of CCR6+ T cells (n = 3). (l) Flow cytometric analysis of intracellular ROS levels in RAW264.7 cells pretreated with LPS for 12 h then treated with PBS (PC), and with no treatment (NC), CCR6‐NVs, and control NVs, respectively. (m,n) Flow cytometry analysis and corresponding quantitative analysis of CFSE‐labelled CD3+ or CD4+T cells treated with PBS, NVs, and CCR6‐NVs for 5 days (n = 3). Error bar, mean ± SD. n.s represents no significant, *P < 0.05; **P < 0.01; ***P < 0.001; ****P < 0.0001.