
FIGURE 4.
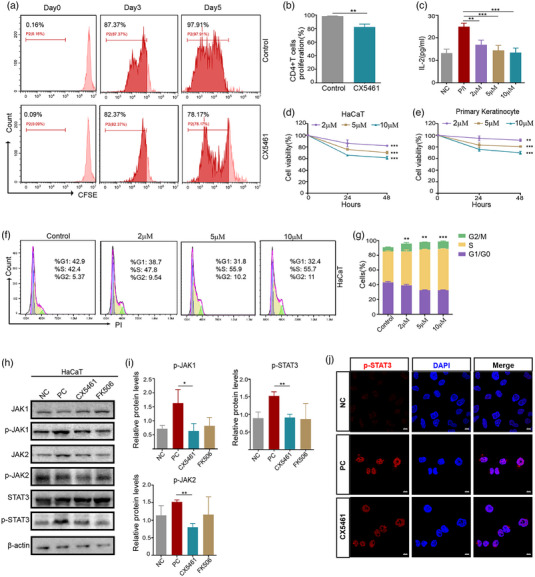
CX5461 inhibited the activation of CD4+T cells and keratinocytes in vitro. (a,b) Flow cytometry analysis of CFSE‐labelled CD4+ T cells treated with control DMSO or CX5461 for 5 days and corresponding quantitative analysis (n = 3). (c) ELISA assay to detect IL‐2 in cell culture supernatants of CD4+T cells stimulated by PMA/Ionomycin (P/I) for 12 h or with no treatment (NC), then treated with DMSO or CX5461 (n = 3). (d,e) Cell viability curve of LPS‐stimulated HaCaT cells and primary murine keratinocytes treated with the indicated different concentrations of CX5461 (n = 3). (f,g) Flow cytometry analysis of HaCaT cell cycle distribution and corresponding quantitative analysis (n = 3). (h) Western blot analysis of the protein levels of JAK1, p‐JAK1, JAK2, p‐JAK2, STAT3, and p‐STAT3 in LPS‐induced HaCaT cells treated with DMSO (PC), CX5461, and FK506. (i) Quantitative analysis of Figure 4h (n = 3). (j) Confocal images of the subcellular localization of p‐STAT3 in LPS‐induced HaCaT cells treated with DMSO (PC) or CX5461, and in HaCaT cells with no treatment (NC). Scale bar: 10 μm. Error bar, mean ± SD. *P < 0.05; **P < 0.01; ***P < 0.001.