
FIGURE 6.
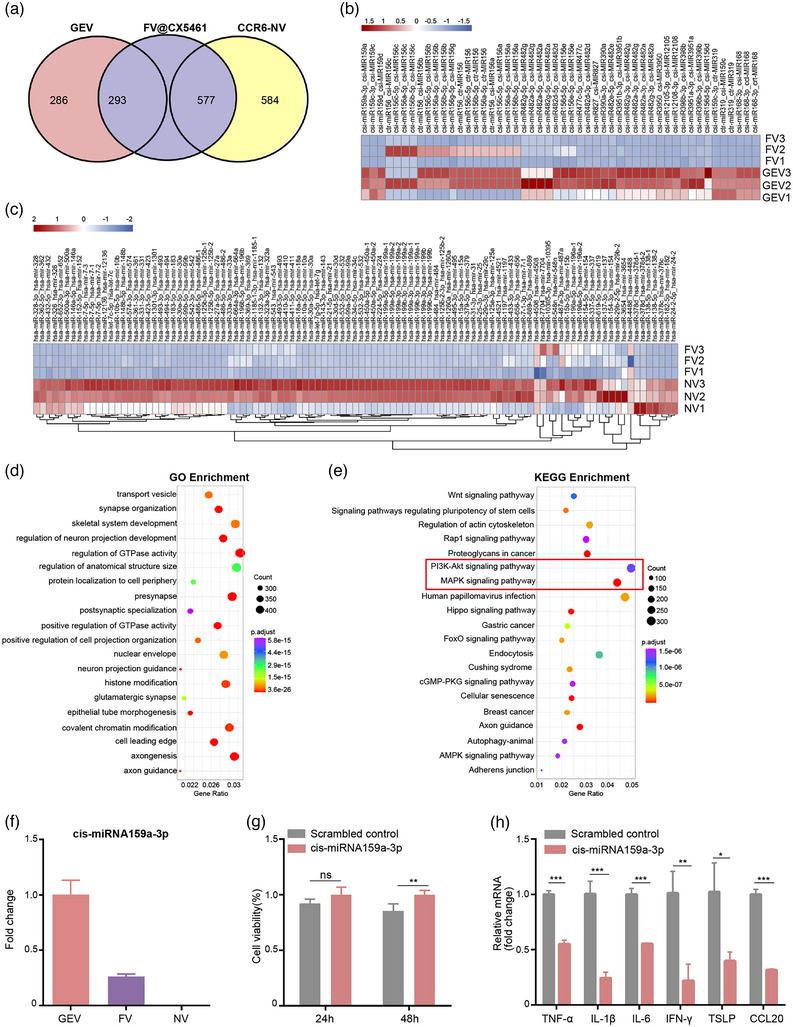
FV@CX5461 contained miRNAs from GEVs and CCR6‐NVs. (a) Venn diagram of miRNAs contained in the GEV, CCR6‐NV, and FV@CX5461. (b) Heatmap of differentially expressed miRNAs in GEVs and FV@CX5461 matched to the miRbase of Citrus species. (c) Heatmap of differentially expressed miRNAs in CCR6‐NVs and FV@CX5461 matched to the miRbase of Homo species. (d,e) GO enrichment analyses and KEGG enrichment analyses of the target genes of miRNAs expressed in FV@CX5461. (f) Relative mRNA Expression of csi‐miR159a‐3p in GEVs, FVs, and NVs. (g) Cell viability of LPS‐induced HaCaT cells transfected with csi‐miR159a‐3p mimics or scrambled control (n = 5). (h) Relative mRNA expression of TNF‐α, IL‐1β, IL‐6, IFN‐γ, TSLP and CCL20 in LPS‐induced HaCaT cells transfected with csi‐miR159a‐3p mimics or scrambled control (n = 3). Error bar, mean ± SD. n.s represents no significant, *P < 0.05; **P < 0.01; ***P < 0.001.