
FIGURE 8.
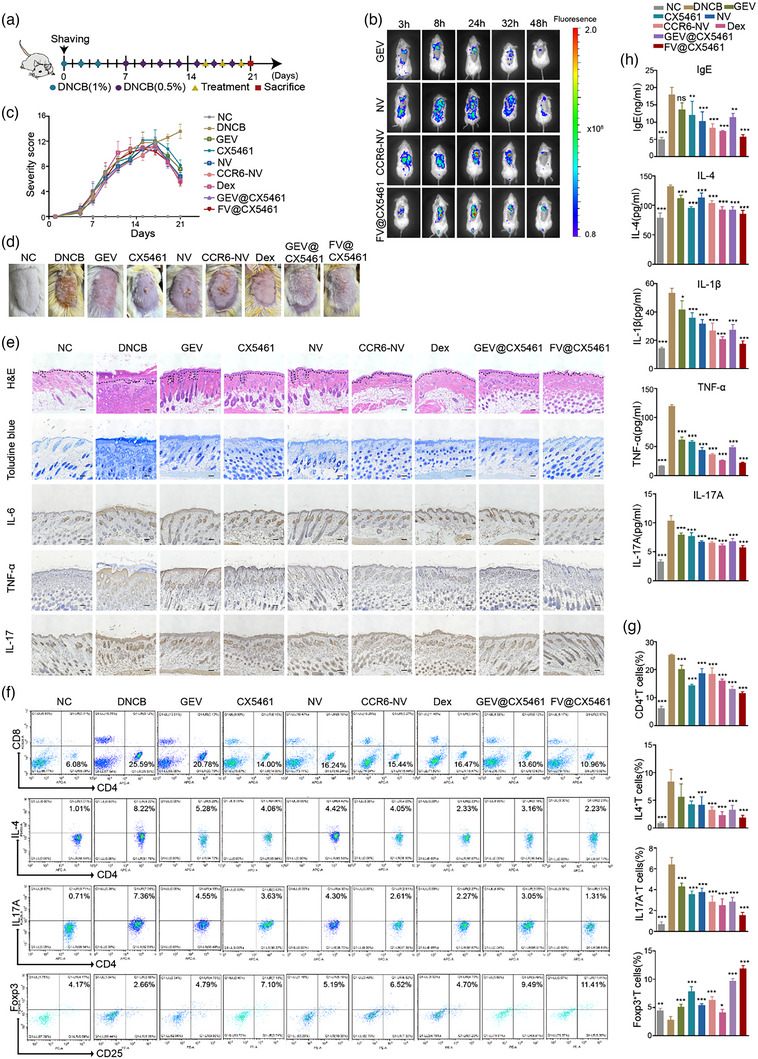
FV@CX5461 mitigated DNCB‐induced atopic dermatitis. (a) Schematic illustration of atopic dermatitis modelling and treatment. 1%DNCB was applied on day 0, day 2, and day 4 in the first week, and 0.5%DNCB was applied every other day for the next two weeks with i.v. administration of drugs on day16, day18, and day20 during the atopic dermatitis modelling. (b) In vivo fluorescence images of DNCB‐induced atopic dermatitis mice treated with GEVs, NVs, CCR6‐NVs, and FV@CX5461. (c) Severity scores of mice in each group (n = 5). (d) Representative images of mouse dorsal skin in each group on the last day. (e) H&E staining, Toluidine blue staining, and immunohistochemistry of lesional skins in each group of mice. Scale bar: 100 μm. (f,g) Representative flow cytometric analysis of CD4+ T cells, CD4+ IL4+ T cells, CD4+ IL17+ T cells, and CD4+ CD25+ Foxp3+ Treg cells in spleens (n = 3). (h) ELISA assay to detect IgE, IL‐4, IL‐1β, TNF‐α, and IL‐17 in the serum (n = 3). Error bar, mean ± SD. n.s represents no significant, *P < 0.05; **P < 0.01; ***P < 0.001.