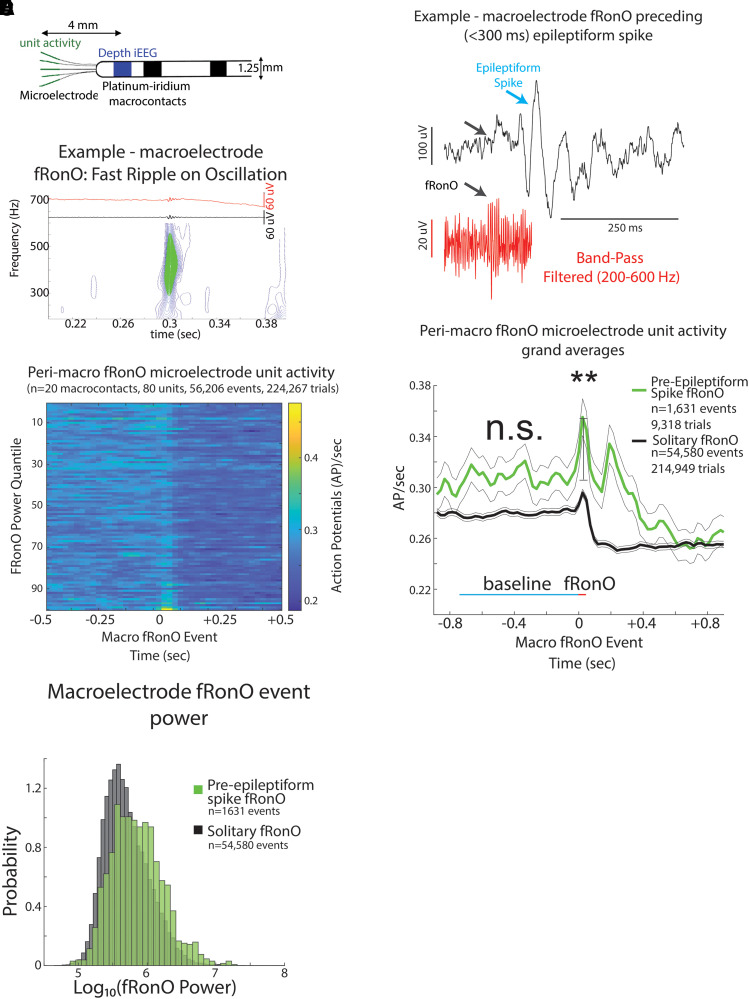
Figure 2.
iEEG fRonO preceding (<300 ms) an inter-ictal iEEG spike is associated with higher spectral power and higher unit firing rate. (A) An illustration of a Behnke–Fried depth electrode. The HFO and spike events are detected in the iEEG recorded from the mesial most depth macroelectrode contact shown in blue, while the unit activity associated with these HFO and spike events is isolated from the LFPs recorded from the microelectrodes in green. Comparisons between the HFO and spike events and unit activity were made exclusively within a single Behnke–Fried depth electrode and not across different depth electrodes. (B) An example fRonO identified using the topographical analysis of the wavelet convolution that quantifies event power. (C) Peri-fRonO unit Gaussian smoothed AP firing rates from 80 units, which exhibited a significant fRonO triggered increase in firing (P < 0.001, FDR corrected), averaged by quantiles defined by the log10(power) of the fRonO events. Higher power fRonOs are associated with a greater increase in AP firing rate (GLMM, , Supplementary Table 4). (D) Representative example of a fRonO event preceding a spontaneous epileptiform discharge with after-going slow wave in a macroelectrode recording. (E) Grand average of the Gaussian smoothed fRonO event-unit AP train trials for solitary peri-fRonO event trials not preceding an epileptiform discharge (black, 95% confidence interval), and peri-fRonO event trials that did precede (<300 ms) an epileptiform discharge (green). Differences in baseline (cyan line) firing rate were not significant (n.s. P > 0.05, GLMM, Supplementary Table 5). fRonO events that preceded an epileptiform discharge, relative to those that did not, had higher peak AP firing rates during the fRonO (red line) compared with baseline (cyan line) (**, GLMM, P < 1e−9, Supplementary Table 2), as well as an after-going secondary increase in firing rates. (F) Normalized histogram of fRonO event spectral power. fRonO events preceding spikes had a larger power (t-test, P < 1e−10, Cohen’s d = 0.475) than solitary fRonO, and the interaction of fRonO power with pre-spike status explained the increase in firing rates (GLMM) during fRonO preceding spikes (GLMM, P < 1e−5, Supplementary Table 4).

