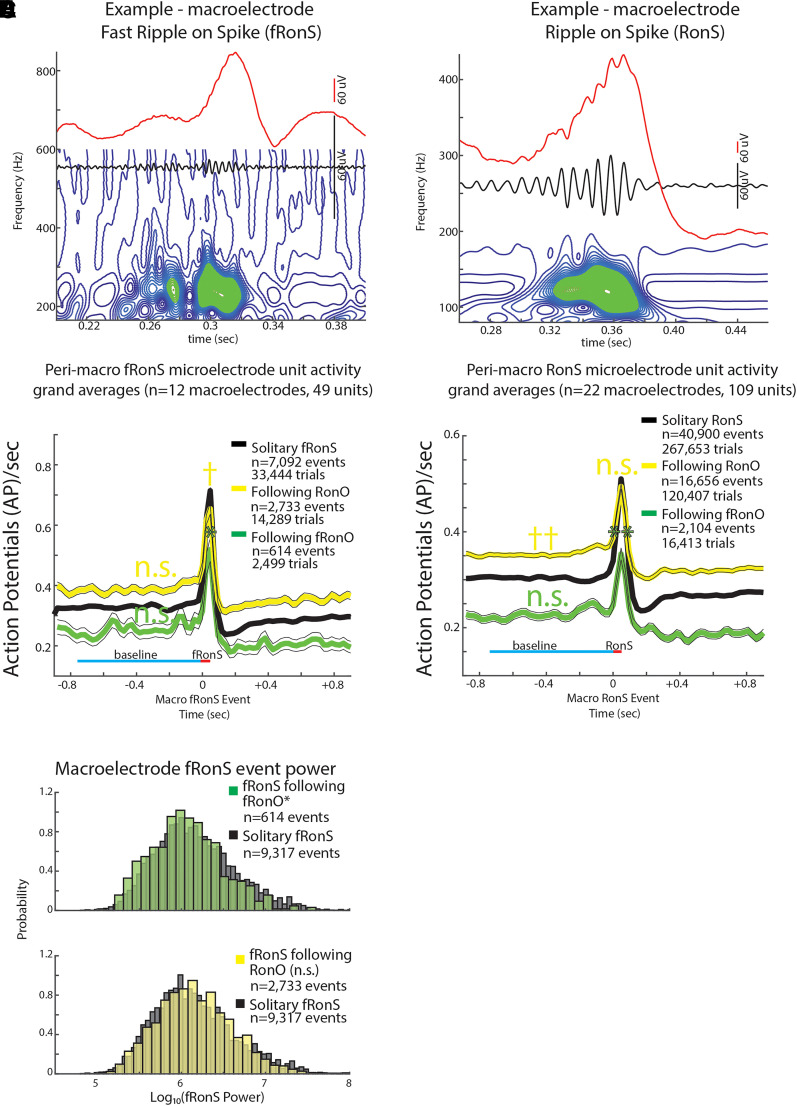
Figure 4.
Unit firing rates prior to and during fRonS and RonS are decreased if preceded (<300 ms) by a fRonO. An example fRonS (A) identified using the topographical analysis of the wavelet convolution. (B) Grand average of the Gaussian smoothed HFO event-unit AP train trials peri-fRonS from 49 units, which showed statistically significant increased fRonS triggered firing (P < 0.001, FDR corrected). Shown are trial averages with no preceding event (black solitary, neither RonO nor fRonO), when a fRonS followed a RonO (yellow), or when a fRonS followed a fRonO (green). AP firing rate during the fRonS was proportional to fRonS log10(power) (GLMM, , not shown, Supplementary Table 11). The baseline AP firing rate (cyan line) for fRonS that followed a fRonO or a RonO was not significantly different (n.s.) from solitary fRonS (n.s., GLMM, P > 0.05, Supplementary Tables 12 and 13). During the fRonS event (red line), the peak AP firing rates relative to baseline (cyan line) was decreased when fRonS event followed a fRonO (*, GLMM, P < 1e−4, Supplementary Tables 10 and 11) but increased if the fRonS event followed a RonO (†, GLMM, P < 1e−5, Supplementary Tables 10 and 11). The latter effect derived in the GLMM is not appreciated in the grand average shown in (B). (C) Normalized histogram of fRonS event power in macroelectrode recordings. fRonS power was reduced when it followed a fRonO (t-test, P < 1e−5, Cohen’s d = 0.21) but unchanged if the fRonS followed a RonO (P > 0.05). (D) An example RonS identified using the topographical analysis of the wavelet convolution. (E) Grand average of the Gaussian smoothed HFO event-unit AP train trials rates peri-RonS from 109 units, which showed statistically significant increased RonS triggered firing (P < 0.001, FDR corrected) as in (B). The baseline AP firing rate (cyan line) for RonS that followed a fRonO or RonO was not significantly different (n.s., GLMM, P > 0.05, Supplementary Table 16) or greater (††, GLMM, , Supplementary Tables 16 and 17) than solitary RonS, respectively. During the RonS event (red line), the peak AP firing rates, relative to baseline (cyan line), was proportional to RonS log10(power) (GLMM, , not shown, Supplementary Table 15); RonS events that followed fRonO, but not RonO (n.s.), exhibited decreased peak AP firing rates, relative to baseline, compared with solitary RonS (**, GLMM, P < 0.05, Supplementary Tables 14 and 15).

