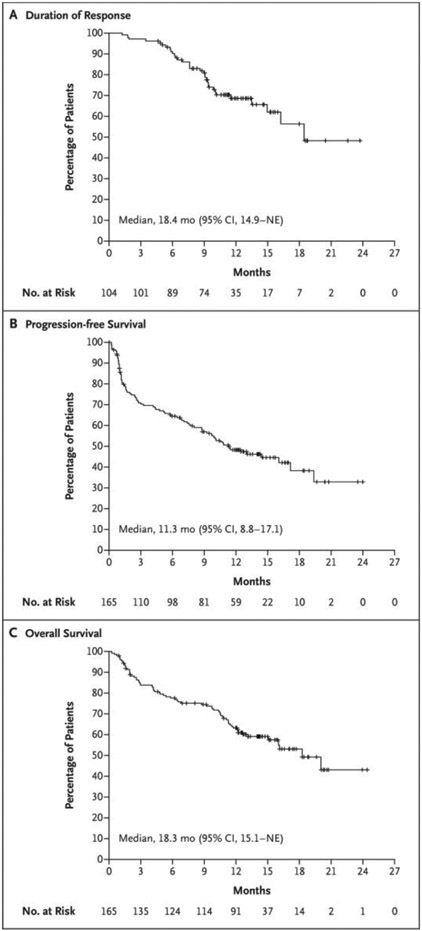
Figure 2. Kaplan–Meier Analysis of Response Duration and of Progression-free and Overall Survival.
Panel A shows the duration of response to teclistamab therapy in the 104 patients who had an overall response (partial response or better) among the 165 patients who received the recommended phase 2 weekly dose of 1.5 mg per kilogram of body weight. Panel B shows progression-free survival in the overall population. Disease progression was assessed by an independent review committee on the basis of the criteria of the International Myeloma Working Group. Panel C shows overall survival among the 165 patients. Tick marks indicate censored data. NE denotes not estimable.

