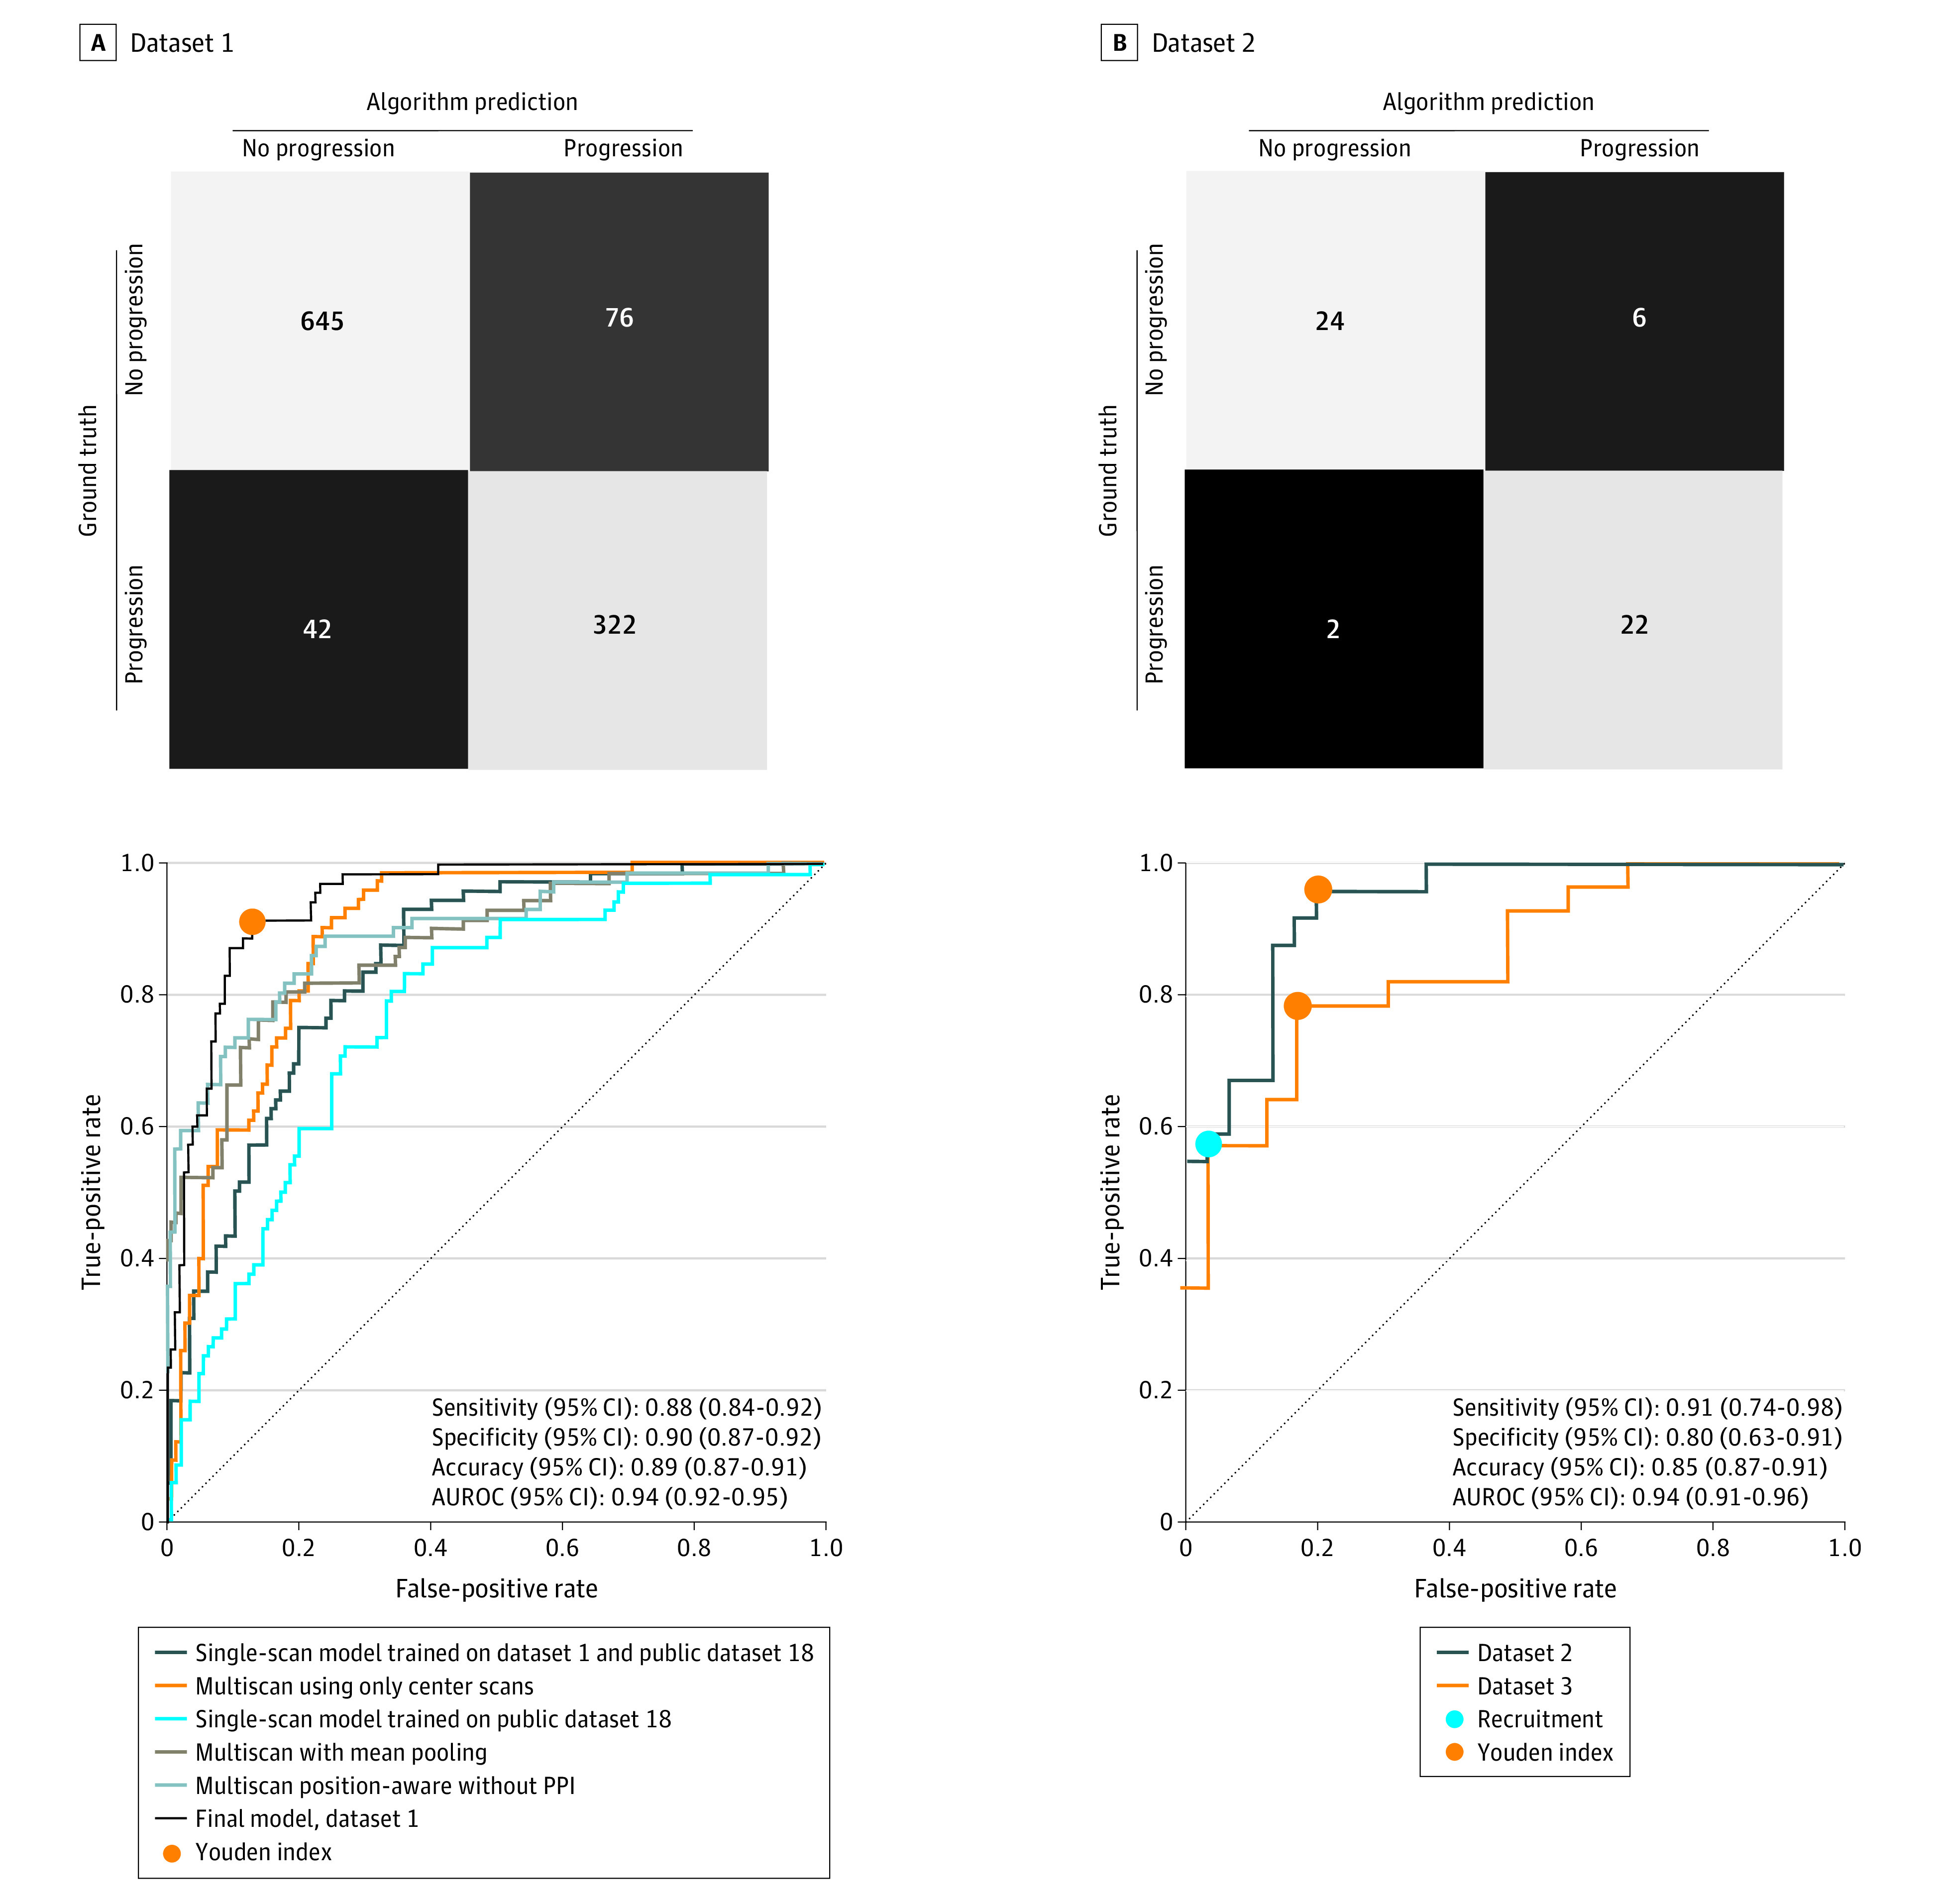
Figure 1. Prediction of Progression From Intermediate Age-Related Macular Degeneration to Geographic Atrophy Within 1 Year Across 3 Independent Data Sets.

Rows of the confusion matrices represent ground truth labels and columns represent model predictions. Assignments were obtained by thresholding-predicted geographic atrophy probabilities with thresholds chosen by Youden index. Area under the receiver operating characteristic curves (AUROCs) for data set 1 depict the final model in addition to lines for ablation design-based studies of the model. AUROCs for data sets 2 and 3 display a high-specificity operating point selected for clinical trial recruitment in addition to 1 identified by Youden index.
