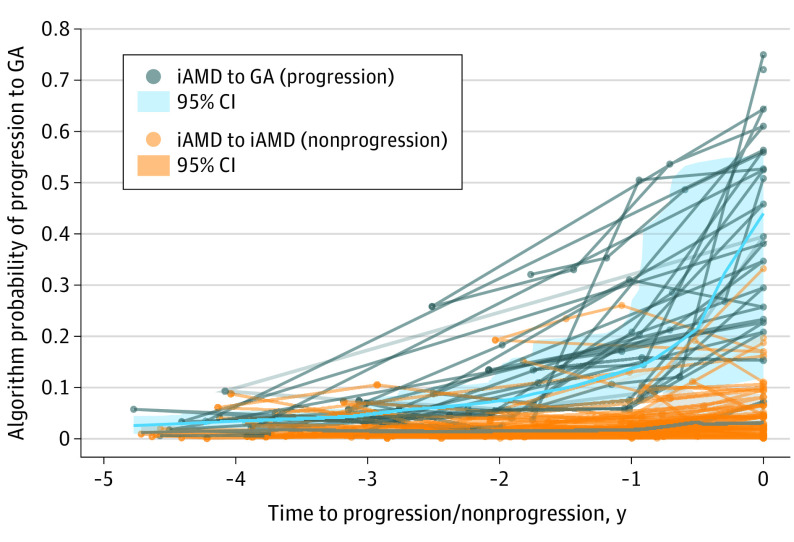
Figure 2. Temporal Specificity of the Model Shown by Prediction of Likelihood of Progression From Intermediate Age-Related Macular Degeneration (iAMD) to Geographic Atrophy (GA) Across 5 Years From the Date of GA Progression or Nonprogression.
The x-axis represents years prior to progression or censoring for those that did not progress. Lightweight lines connect spectral-domain optical coherence tomography scans from the same patient across time, whereas the bold lines average probabilities from all cases within the 2 groups.

