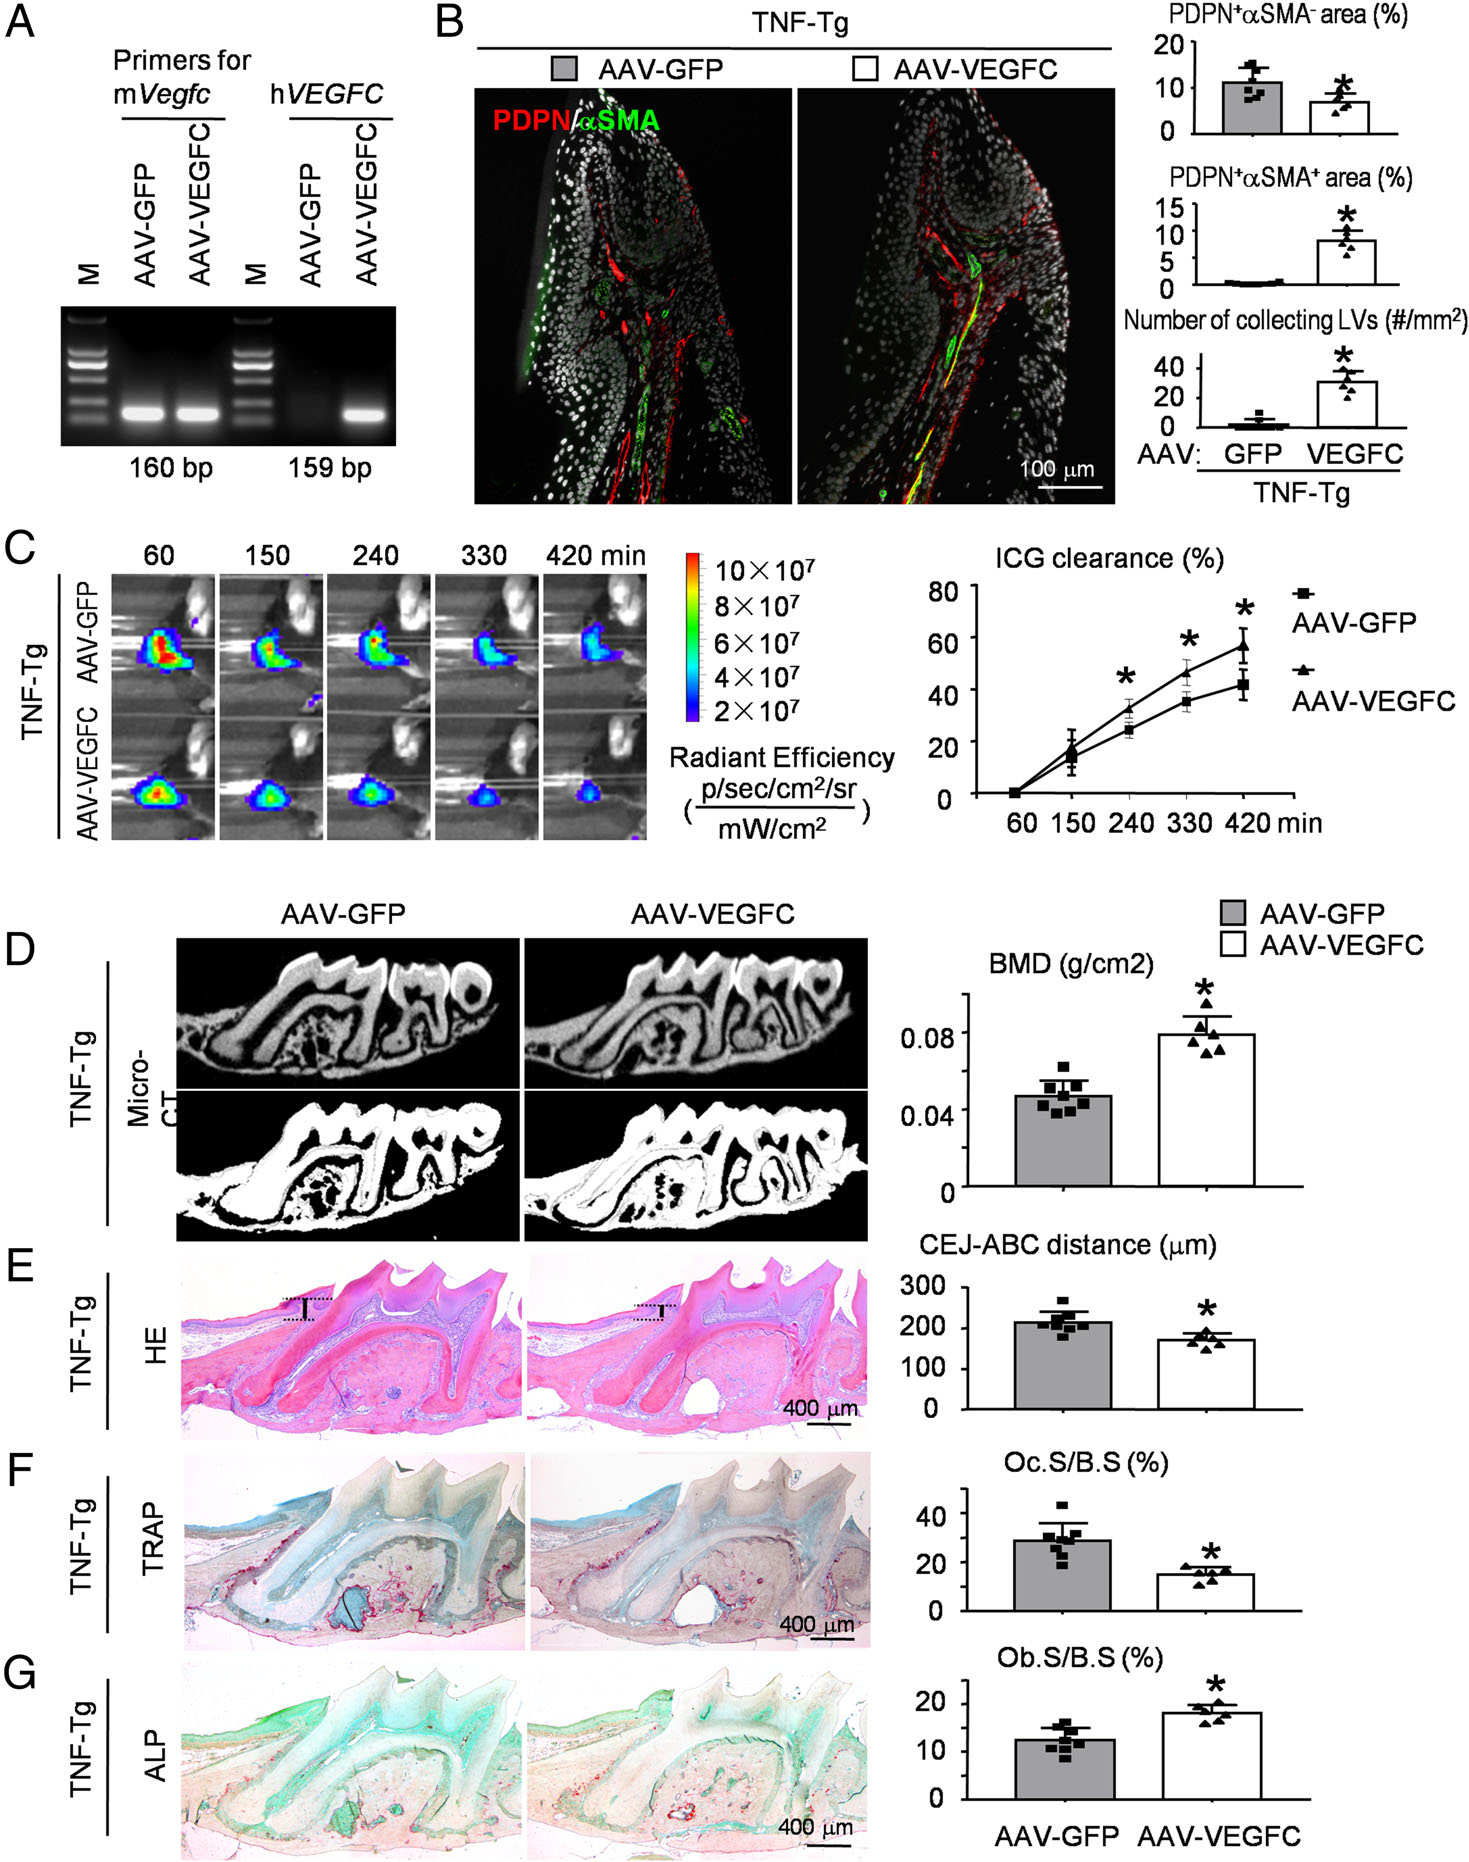
Figure 4.

AAV-VEGFC increases local lymphatic drainage and reduces alveolar bone loss in RA-associated periodontitis. Four-month-old TNF-Tg mice received local injection of AAV-GFP control virus (left maxillary) or AAV-VEGFC virus (right maxillary) into periodontal tissues of the left and right maxillary first molar, respectively. Two months after viral injection, mice were sacrificed and analyzed. (A) Expression of virus-encoded human VEGFC in periodontal tissues of TNF-Tg mice. (B) Paraffin sections of maxillae were subjected to IF for PDPN (red) and αSMA (green). Representative images of periodontal tissue showing the distribution of PDPN+/αSMA− lymphatic capillaries (red), PDPN+/αSMA+ collecting LVs (yellow), and PDPN−/αSMA+ blood vessels (green). Quantification of the PDPN+αSMA− area or PDPN+αSMA+ area to tissue area (%) was determined. The number of PDPN+αSMA+ collecting LVs per mm2 tissue areas (#/mm2) was calculated. (C) An example of in vivo washout of ICG in periodontal tissues reflecting lymph flow through all time points. ICG clearance (%) was quantified. Values shown are mean ± SEM. *p < 0.05 versus AAV-GFP control virus at the same time point. (D) Representative 3D scanned sections (upper panels) and reconstructed sections (lower panels) along the longitudinal direction of the maxillae. Bone mineral density (BMD, g/cm2) was analyzed. (E) Representative images of H&E-stained paraffin sections. Measurement of the bone levels by comparing the distance from the cemento-enamel junction (CEJ) to the alveolar bone crest (ABC) in μm was determined. (F) Representative images of TRAP-stained paraffin sections. The percentage of alveolar bone surface covered by osteoclasts (Oc.S/B.S) was determined. (G) Representative images of ALP-stained paraffin sections. The percentage of alveolar bone surface covered by osteoblasts (Ob.S/B.S) was determined. *p < 0.05 versus AAV-GFP control virus. N = 6–8. A two-tailed unpaired Student’s t-test was performed.
