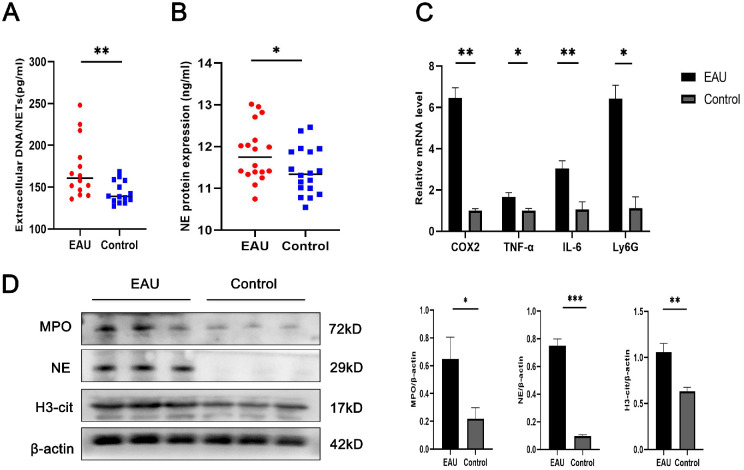
Figure 6.
NET production is increased in EAU mice. (A) The levels of extracellular DNA indicated the presence of NETs in EAU mice (n = 14 per group). (B) The levels of NE indicated the presence of NETs in EAU mice (n = 18 per group). (C) RT-qPCR of Ly6G, COX2, IL-6, and TNF-α expression in the retinas (n = 3 per group). (D) Western blot for H3Cit, NE, and MPO expression in retinas (n = 3 per group). The protein samples were quantified using densitometry through ImageJ software and normalized. The data were expressed as mean ± SD and analyzed using an unpaired t test. *P < 0.05, **P < 0.01.

