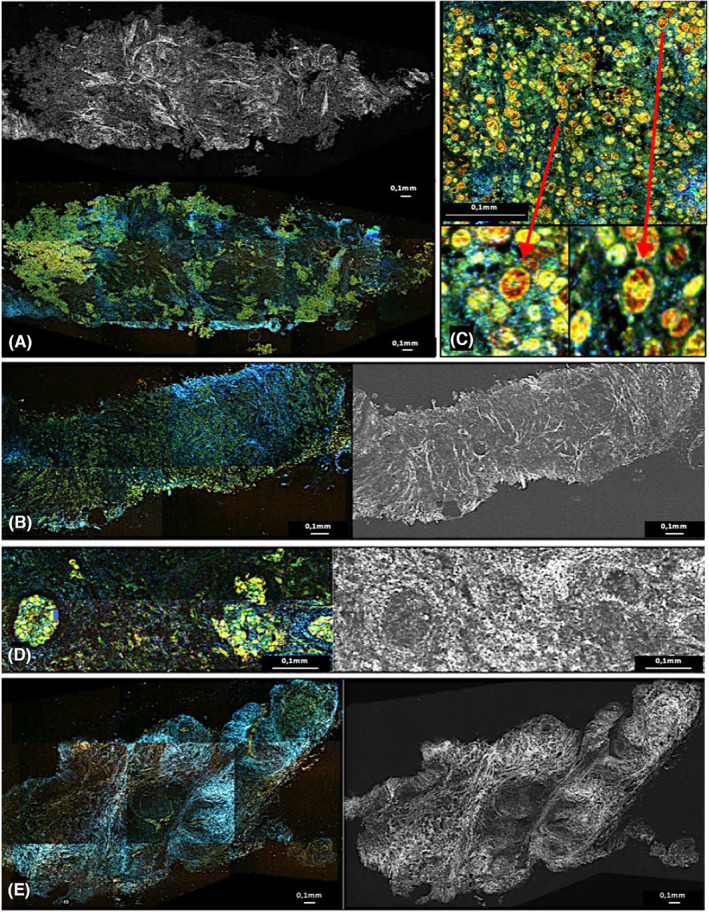
FIGURE 2.

Images in dynamic cell imaging (DCI) and full‐field optical coherence tomography (FFOCT): two infiltrating cancer diagnosed on pathology (A,B). Focusing on cells with ×10 enlargement on bottom images (C). Normal galactophoric duct (D). Adenofibroma (E). In DCI, cells appear as yellow formation with black or red core, extracellular matrix appear as blue linear formations. We see the cellular infiltrate visible in gray/dark on the FFOCT image and in green/yellow on the DCI image. The cells are grouped in clusters or linearly. This is in contrast to the near absence of cells in the adenofibroma or the normal organization of the galactophoric ducts. Irregular and sharps zone of fibrosis visible in bright white (FFOCT) and in blue (DCI) surrounds these infiltrates corresponding to cancerous stroma reaction (A) and is different to the fibrosis visible as gray/white matter visible on the adenofibroma (F) or next to the normal duct (E). Focusing on these infiltrates, we see that the cells are abnormal, irregular in shape and size, and composed of clusters of red/black matter. “Double” cells that may correspond to mitoses are visible. (C) They are opposed to the normal small and similar sizes cells without red clusters and well arranged in two layers within the galactophoric ducts.
