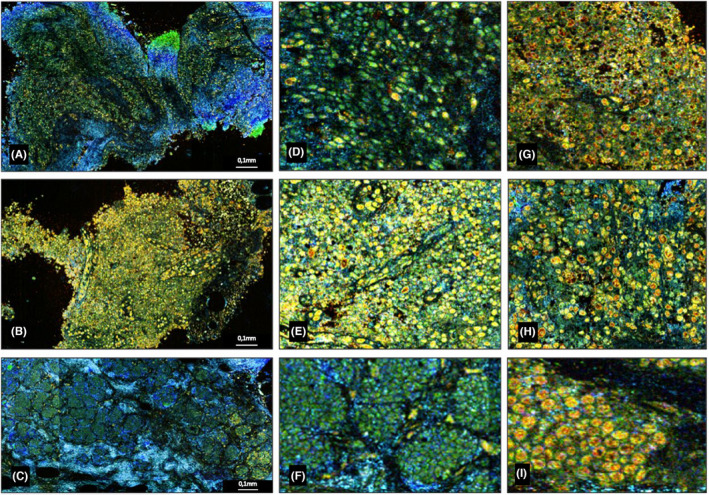
FIGURE 3.

Dynamic cell imaging (DCI) images. Papilloma (A). Histiocytosis (B). Adenoma (C). ×10 focusing on each samples (D–F) with cancerous cell comparison (G–I). In DCI, cells appear as yellow formation with black or red core, extracellular matrix appear as blue linear formations. We can observe that benign specimens can also contain a large cellularity visible as green/yellow cells (A–C). But we notice that they contain more regular and cohesive cells (D–F) with less red/black clumps compared to the malignant specimens (GI). Finally, for adenomas, they are grouped and well‐organized (C).
