FIGURE A2.

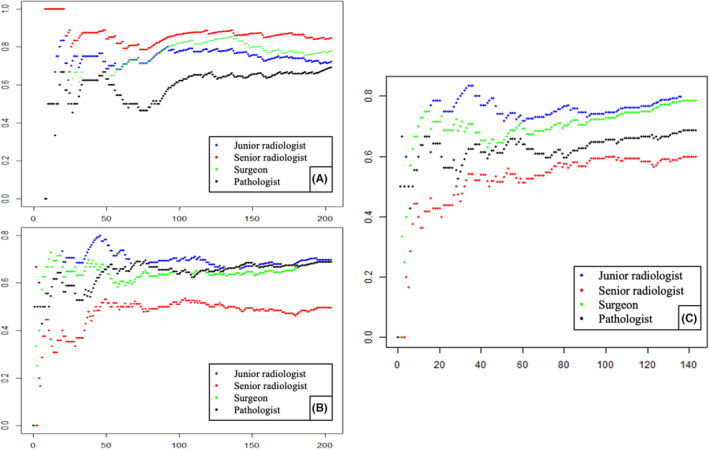
Learning curves. A and B: sensitivity (A) and specifiticity (B) on the y‐axis. The number of lectures is on the x‐axis. C: concerning only the breast lesions with specificity on y‐axis and number of lectures on the x‐axis.

Learning curves. A and B: sensitivity (A) and specifiticity (B) on the y‐axis. The number of lectures is on the x‐axis. C: concerning only the breast lesions with specificity on y‐axis and number of lectures on the x‐axis.