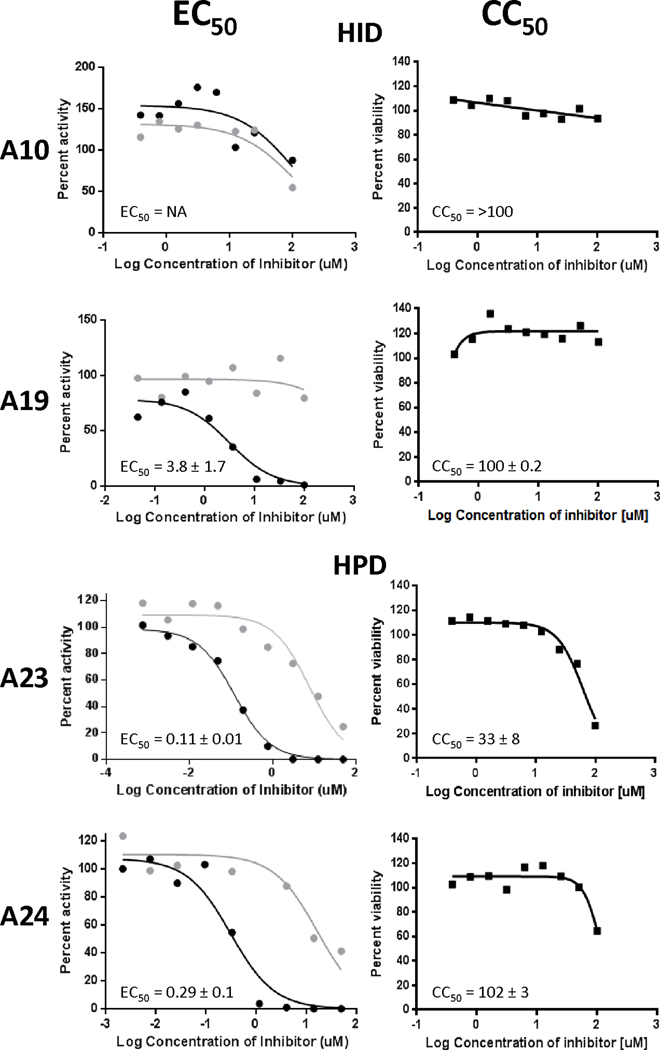
Figure 1. Representative replication inhibition efficacy and cytotoxicity assays.
Replication inhibition by representative HIDs and HPDs was measured against an HBV genotype D isolate in HepDES19 cells using a strand preferential q-PCR assay. EC50 values were calculated based on the decline of the positive-polarity DNA strand relative to the DMSO vehicle treated controls. Positive-polarity DNAs are in black; negative-polarity DNAs are in grey. EC50 values are the average of three experiments ± one standard deviation. Cytotoxicity was measured by MTS assay and CC50 values are the averages of three experiments ± one standard deviation.

